
November 10, 2026
Live Gold prices are attracting significant attention in global financial markets on Tuesday, 10 November 2026, as investors assess changing US dollar movements, Federal Reserve interest rate expectations and developments in international geopolitics. After recovering strongly during the previous week, the precious metal is showing signs of consolidation, with traders closely monitoring important technical levels ahead of the latest US inflation report.
According to early Asian trading market data, spot gold (XAU/USD) was trading around $4,128 per troy ounce, following a modest decline of approximately 0.3%. The market is currently balancing renewed safe-haven interest against expectations that US monetary policy could remain restrictive.
For investors, traders and gold market participants in Dubai, today's price action presents an important opportunity to evaluate the short-term direction of the precious metal. Gold Trade presents this daily gold technical analysis report to highlight market trends, key support and resistance zones, and possible trading scenarios.
Gold Price Today: Market Overview for 10 November 2026
The international gold market has experienced considerable movement over recent trading sessions. Gold recorded a strong recovery last week, supported by a weaker US dollar, geopolitical developments and changing expectations regarding future interest rate decisions.
However, stronger-than-expected US employment figures have introduced fresh uncertainty. The October employment report showed an increase of 165,000 jobs, considerably above market expectations of approximately 65,000. Strong employment conditions could give the Federal Reserve additional reasons to maintain a cautious approach towards monetary easing.
Meanwhile, falling crude oil prices and improving investor confidence have reduced some immediate inflation concerns. These developments have created a mixed environment for gold.
The major event influencing today's market is the release of US October Consumer Price Index (CPI) data. Investors will examine the inflation figures for indications of whether interest rates could remain elevated or whether monetary conditions may become more supportive for non-yielding assets such as gold.
Gold Technical Analysis: Understanding the Current XAU/USD Trend
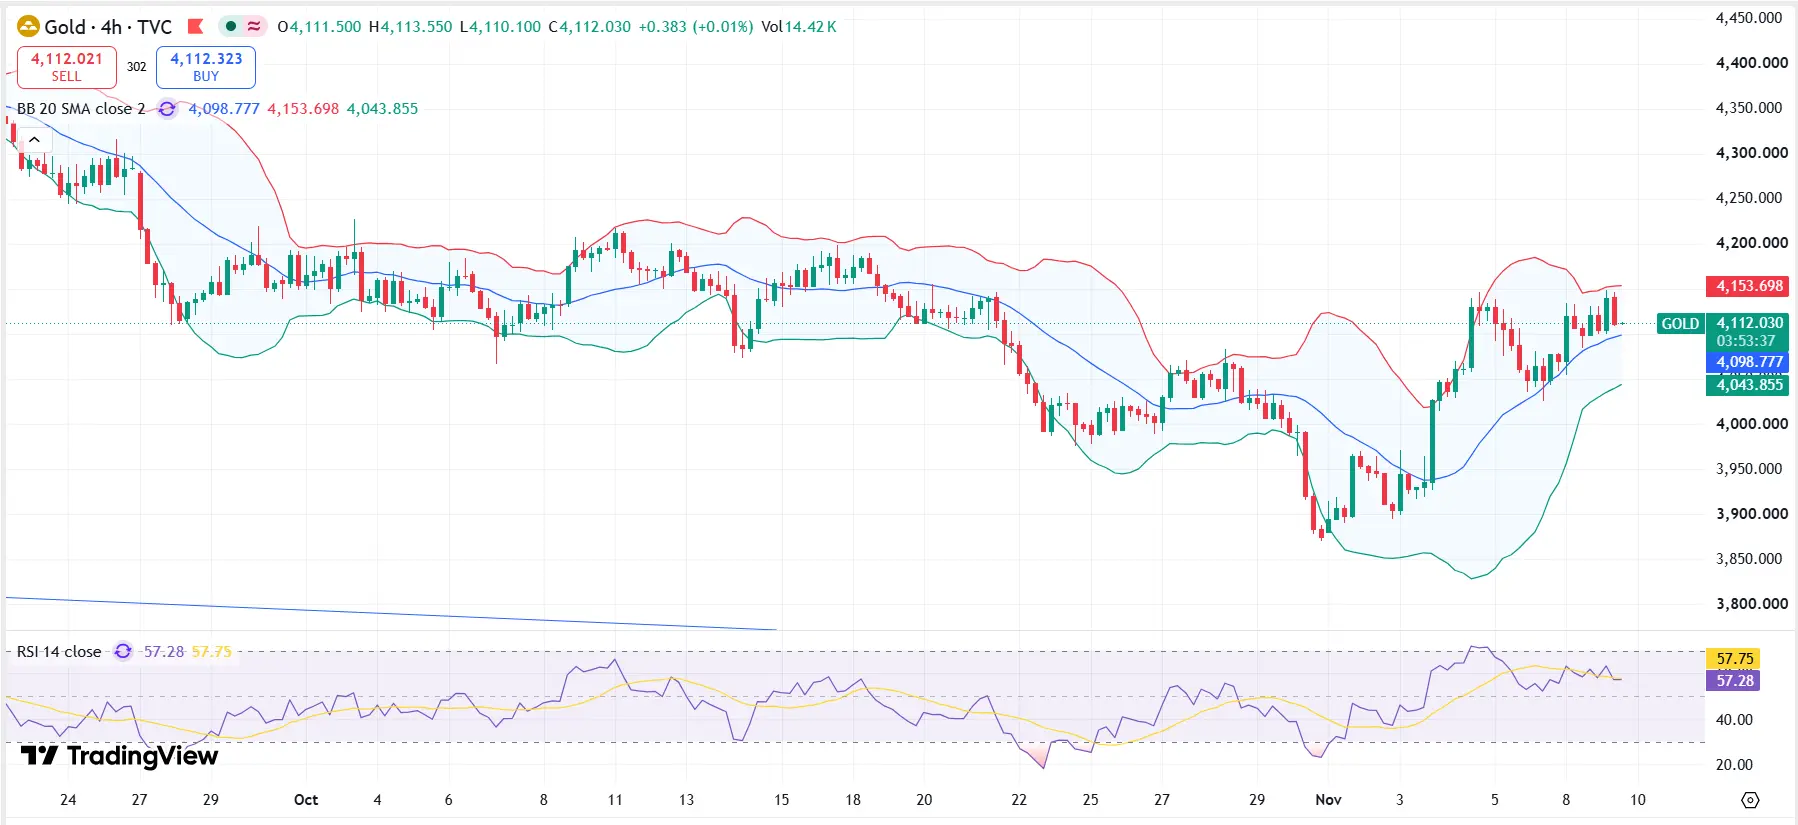
From a technical perspective, gold is trading in a consolidation phase following its recent recovery. The metal has maintained prices above the psychologically important $4,000 level, which remains an important reference point for market participants.
The immediate technical picture suggests that buyers are attempting to maintain upward momentum, although selling pressure around nearby resistance could limit further gains.
The $4,145–$4,157 region represents an important resistance area. A sustained move above this zone could strengthen bullish sentiment and create opportunities for an extension towards higher price levels.
On the downside, the $4,074–$4,082 area represents an important near-term support zone. If sellers push gold below this region, attention could shift towards the $4,025–$4,036 area.
Traders should monitor price action around these levels rather than relying exclusively on individual price movements. A confirmed breakout, supported by stronger momentum and trading participation, would provide a more meaningful indication of the next market direction.
Important Gold Support and Resistance Levels – 10 November 2026
The following price zones are important for today's XAU/USD technical analysis:
| Technical Level | Price (USD/oz) | Market Significance |
|---|---|---|
| Resistance 3 | $4,227 | Extended bullish target |
| Resistance 2 | $4,187 | Potential upside objective |
| Resistance 1 | $4,145–$4,157 | Immediate resistance |
| Current Reference | $4,128 | Approximate market price |
| Support 1 | $4,074–$4,082 | Immediate support |
| Support 2 | $4,025–$4,036 | Secondary support |
| Support 3 | $4,000 | Psychological support |
These are indicative technical reference zones, not guaranteed execution prices. Market volatility around economic announcements can produce temporary movements beyond established levels.
Bullish Scenario: Can Gold Break Above $4,157?
The bullish outlook could strengthen if gold successfully moves above the $4,145–$4,157 resistance zone and maintains its position above this area.
A confirmed breakout could attract additional buying interest, particularly if the US CPI report indicates easing inflationary pressure. Softer inflation could reduce expectations of further monetary tightening, potentially weakening the US dollar and supporting demand for precious metals.
If bullish momentum continues, the next areas of interest would be $4,187 and $4,227.
For Dubai-based gold investors, a sustained international price increase could also influence local bullion prices, although the final retail price will depend on purity, currency conversion, dealer premiums and other market costs.
Nevertheless, traders should avoid assuming that every resistance breakout will result in a sustained rally. Confirmation through price action remains essential.
Bearish Scenario: What Happens If Gold Falls Below $4,074?
The bearish scenario becomes more relevant if gold fails to hold its immediate support between $4,074 and $4,082.
A decisive move below this region could indicate weakening buying momentum and encourage additional selling activity. In this situation, the next important downside reference would be $4,025–$4,036.
A deeper decline could bring the psychologically important $4,000 level into focus.
Stronger-than-expected US inflation figures could contribute to this bearish scenario by increasing expectations of higher interest rates. Higher Treasury yields and a stronger US dollar generally create additional pressure on gold because the metal does not generate interest income.
However, geopolitical uncertainty and central bank gold purchases could provide underlying support and potentially limit the extent of any correction.
Major Factors Influencing Gold Prices Today
Several economic and financial developments are likely to influence gold prices on 10 November 2026.
1. US Inflation Data
The October US CPI report is today's most important scheduled economic event for gold traders. Lower-than-expected inflation could support gold, while a higher reading could strengthen expectations of restrictive Federal Reserve policy.
2. US Dollar Performance
Gold is internationally priced in US dollars. Consequently, changes in dollar strength can influence international demand and short-term gold price movements. A weaker dollar generally supports gold, while a stronger dollar can create selling pressure.
3. Federal Reserve Interest Rate Expectations
Interest rate expectations remain a major driver of precious metals. Since gold does not pay interest, rising yields can increase the opportunity cost of holding bullion. Conversely, expectations of lower rates can improve its investment appeal.
4. Geopolitical Developments
International tensions and diplomatic developments continue to influence safe-haven demand. Any significant escalation in geopolitical uncertainty could encourage investors to increase exposure to gold.
5. Central Bank Gold Purchases
Central banks remain important participants in the global gold market. Continued official-sector accumulation can contribute to longer-term demand and reinforce gold's position as a strategic reserve asset.
Gold Market Outlook for Dubai Investors
Dubai is one of the world's important centres for physical gold trading, bullion distribution and jewellery commerce. International gold price movements are particularly relevant to local traders, retailers and investors because the UAE gold market closely follows global bullion benchmarks.
For customers in Dubai, understanding the relationship between international spot prices and local gold rates is essential.
The UAE dirham is pegged to the US dollar, which means international dollar-denominated gold movements are particularly relevant to local pricing. However, the final price of physical gold also depends on purity, dealer margins, manufacturing charges and applicable taxes.
Investors considering purchases of 24K, 22K or 18K gold should compare current local rates and understand the difference between investment bullion and jewellery pricing.
At Gold Trade, we believe that informed decisions begin with understanding both international market movements and local pricing conditions. Monitoring technical levels alongside fundamental developments can help investors develop a more balanced perspective on the gold market.
Gold Price Prediction for 10 November 2026
The short-term outlook for gold remains dependent on the interaction between technical resistance, immediate support and the upcoming US inflation figures.
The bullish case requires a sustained break above $4,157, with $4,187 and $4,227 serving as subsequent reference levels.
Alternatively, a breakdown below $4,074 could increase downside pressure towards $4,036 and $4,025, followed by the major psychological level of $4,000.
Therefore, the market currently presents a conditional outlook rather than a confirmed directional trend. Traders should pay particular attention to the CPI announcement and avoid making decisions based solely on temporary price fluctuations.
Frequently Asked Questions About Gold Prices
1. What is the gold price today, 10 November 2026?
Gold was trading at approximately $4,128 per troy ounce during early Asian trading on 10 November 2026. International spot prices fluctuate continuously, so investors should check live market quotations before making transactions.
2. Is gold bullish or bearish today?
Gold is showing a consolidation pattern following its recent recovery. A sustained move above $4,157 could strengthen the bullish outlook, while a break below $4,074 could increase downside risks.
3. What are the important support levels for gold today?
The immediate support zone is $4,074–$4,082, followed by $4,025–$4,036. The $4,000 level is another important psychological support.
4. What is the next resistance level for XAU/USD?
The immediate resistance zone is $4,145–$4,157. A confirmed breakout could open the way towards $4,187 and $4,227.
5. Why is the US CPI report important for gold prices?
US inflation data influences Federal Reserve interest rate expectations, Treasury yields and the US dollar. These factors can significantly affect demand for gold.
6. Does international gold price movement affect Dubai gold rates?
Yes. Dubai gold rates are closely linked to international bullion prices. However, local currency pricing, gold purity, dealer margins and applicable charges also influence the final retail price.
Final Thoughts: Gold Trade's Daily Market Perspective
Gold enters 10 November 2026 with a cautiously consolidating outlook, trading near $4,128 per ounce as investors prepare for important US inflation data.
The $4,145–$4,157 resistance zone and $4,074–$4,082 support area are the immediate technical levels to watch. A breakout or breakdown from this range could provide a clearer indication of the next short-term direction.
For investors and gold market participants in Dubai, staying informed about international prices, economic announcements and technical market developments is essential.
Gold Trade remains committed to sharing informative gold market insights, technical analysis and market updates to help customers better understand developments in the global precious metals industry.
Disclaimer
This gold technical analysis is provided for informational and educational purposes only. It does not constitute investment, financial or trading advice. Gold prices can change rapidly, particularly during major economic announcements. Always conduct independent research and consult a qualified financial professional before making investment decisions.