
November 12, 2026
Gold Market Overview
Gold prices are showing signs of short-term stability on 12 November 2026, with the precious metal trading around $3,978 per ounce after touching an intraday low of $3,974. The latest price action suggests that buyers are attempting to defend lower levels, although the market needs stronger bullish momentum to confirm a meaningful recovery.
The immediate focus for traders is whether gold can sustain its position above $3,974 and move towards the next resistance zone. A successful recovery could encourage additional buying, while a decisive break below this level may expose gold to further downside pressure.
Gold Technical Analysis: Bullish or Bearish?
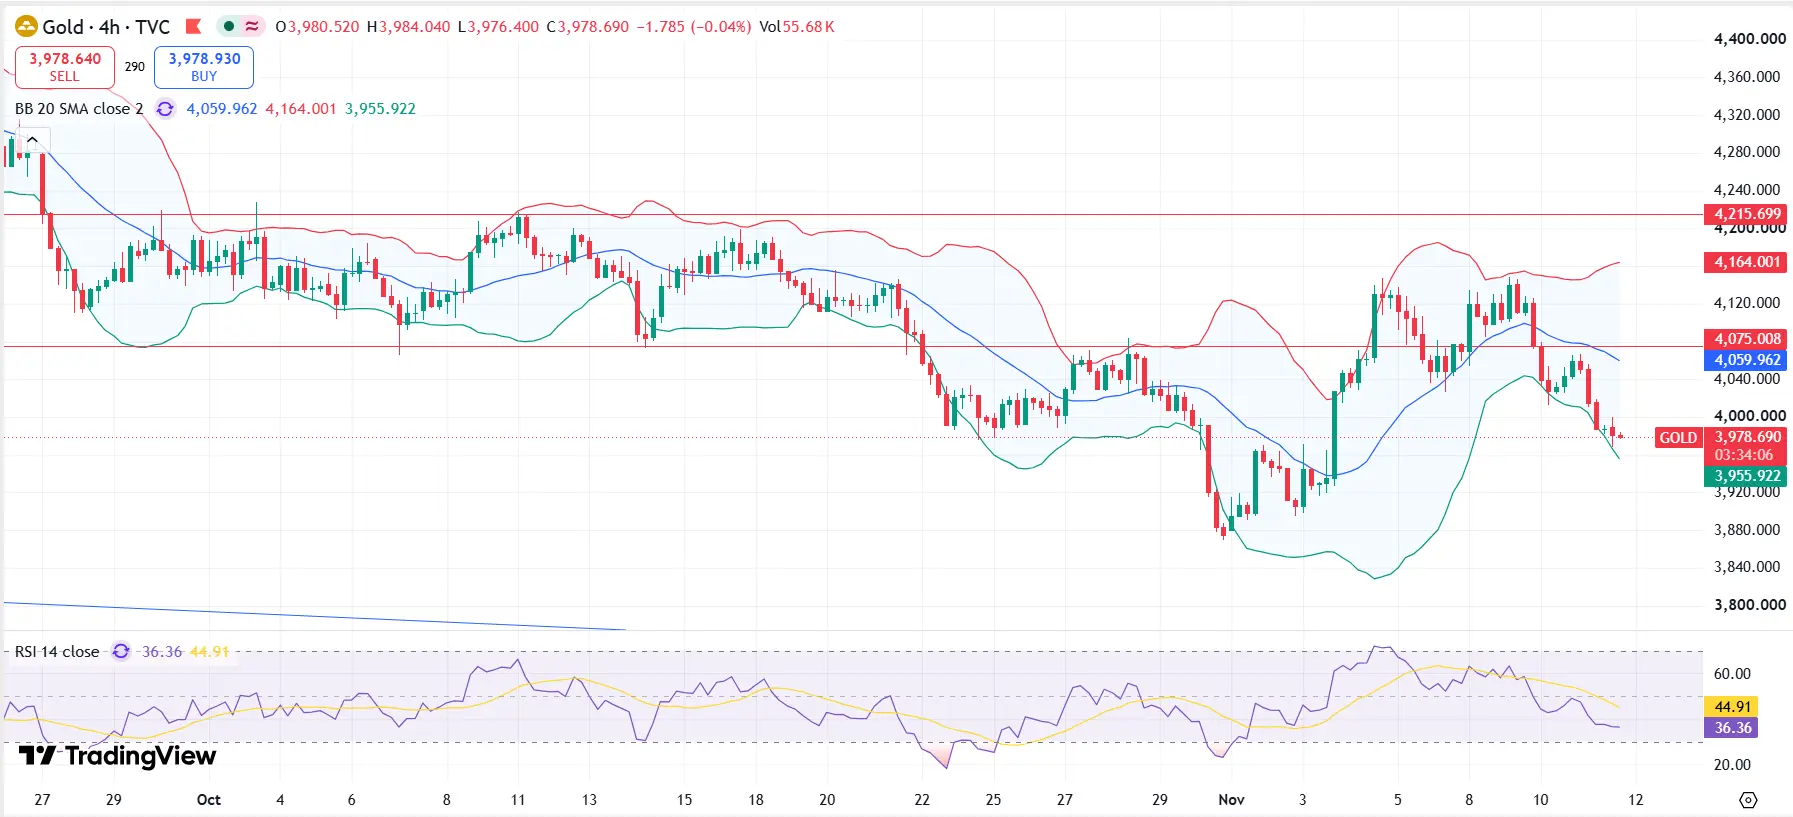
From a short-term technical perspective, gold is showing a cautious recovery attempt, but the overall outlook remains neutral to bearish until the price reclaims important resistance levels.
The $3,974–$3,976 area is the immediate support zone. Holding above this region could encourage buyers to push prices towards $3,990 and the psychological $4,000 barrier.
A sustained move above $4,000 would improve the intraday outlook. Further buying could then target $4,019, followed by $4,058.
On the downside, a decisive break below $3,974 could bring additional selling pressure. Traders should watch whether gold finds fresh demand around $3,950 or moves towards the next major support area near $3,928.
Important Gold Support and Resistance Levels – 12 November 2026
| Technical Levels | Price (USD) |
|---|---|
| Resistance 3 | $4,058 |
| Resistance 2 | $4,019 |
| Resistance 1 | $4,000 |
| Current Gold Price | $3,978 |
| Support 1 | $3,974 |
| Support 2 | $3,950 |
| Support 3 | $3,938 |
| Major Support | $3,928 |
Bullish Scenario: Can Gold Reclaim $4,000?
If gold maintains its position above $3,974, buyers could attempt another recovery towards $3,990–$4,000.
A strong breakout above $4,000, particularly with sustained buying volume, could open the door towards $4,019. If bullish momentum continues beyond that level, $4,058 becomes the next upside objective.
However, a temporary move above $4,000 should not automatically be considered a confirmed trend reversal. Buyers need to establish acceptance above resistance.
Bearish Scenario: Will Gold Break Below $3,974?
The bearish scenario becomes stronger if gold fails to defend $3,974.
A sustained move below this support could expose $3,950, followed by $3,938. If selling accelerates, $3,928 could become the next important downside target.
A weaker US dollar or declining Treasury yields could interrupt this bearish move, while renewed hawkish expectations from the Federal Reserve could increase pressure on gold.
Gold Forecast for 12 November 2026
Gold is approaching an important technical decision zone. The immediate battle between buyers and sellers is concentrated around $3,974–$4,000.
The short-term outlook remains cautiously bearish below $4,000, while a sustained breakout above $4,019 could improve the bullish outlook.
For traders, the most important levels to monitor today are $3,974 on the downside and $4,000–$4,019 on the upside. A confirmed breakout from this range could provide a clearer indication of gold's next directional move.
To buy gold visit our online bullion store
Disclaimer
This article is original market commentary based on the supplied price information. Technical levels are indicative and not guaranteed turning points. This analysis is for educational purposes only and should not be treated as financial advice.