September 15, 2025
Gold’s Golden Streak: Technical Analysis Signals Further Gains Amidst Global Shifts Originally Published by Gold Trade, Dubai
DUBAI – As we close the first half of September, the gold market continues its extraordinary rally, with the yellow metal maintaining a bullish trajectory driven by a potent mix of macroeconomic factors and technical indicators. At Gold Trade, Dubai, we’ve been closely monitoring this unprecedented surge, which has seen gold prices push to new, all-time highs. This report delves into the technical analysis underpinning this rally and provides an outlook for investors and traders in the coming weeks.
The Technical Picture: Bullish Momentum Intact
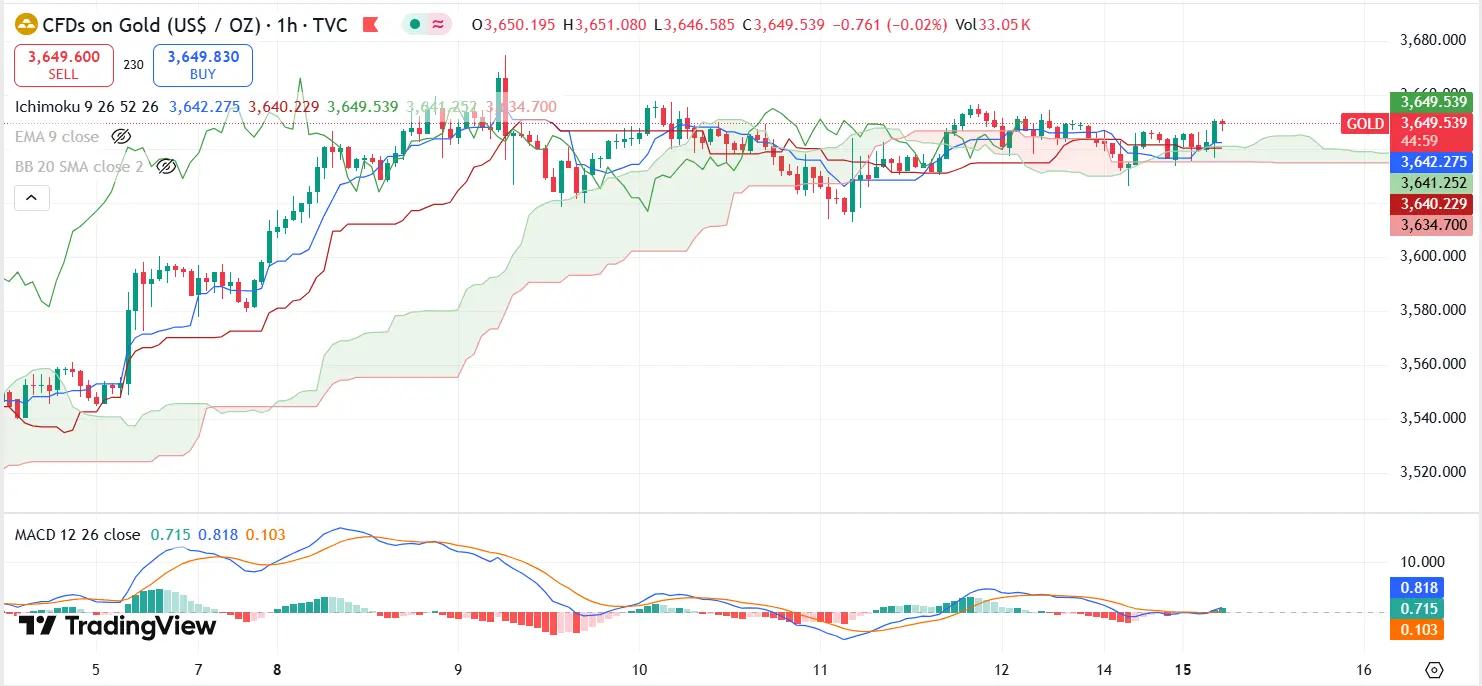
The daily chart for gold (XAU/USD) paints a clear picture of strong bullish momentum. The price has been oscillating within a well-defined ascending channel since its low in late August, with the lower boundary now acting as a crucial support level at approximately $3,600. This channel formation suggests a steady and sustainable upward trend rather than a short-lived spike.
- Key Resistance and Support Levels: Gold has successfully held above the pivotal $3,600 support level, reinforcing the bullish sentiment. It's currently testing a new intermediate resistance range between $3,665 and $3,675. A decisive break and close above this level could trigger the next leg of the rally, pushing prices toward the next resistance targets at $3,687 and potentially $3,725. The latter target aligns with the upper boundary of the ascending channel, making it a significant psychological and technical milestone. On the downside, a break below $3,600 would invalidate the current bullish tone, potentially leading to a corrective decline toward $3,561 and $3,536.
- Moving Averages and Indicators: An analysis of key technical indicators supports the bullish case. The 8-day Exponential Moving Average (EMA 8) is now positioned firmly above the 21-day EMA (EMA 21) , a classic bullish crossover signal that indicates strengthening upward momentum. Furthermore, the Relative Strength Index (RSI) is holding around 55, well below the overbought threshold of 70. This suggests that there is still ample room for further price appreciation before the market becomes excessively overbought and triggers a significant profit-taking correction. The Moving Average Convergence Divergence (MACD) indicator is also trading above its signal line with a positive histogram, reaffirming the strengthening bullish bias.
Fundamental Drivers: A Perfect Storm for Gold
While the technicals are compelling, the fundamental backdrop is creating a "perfect storm" that is likely to sustain gold's rally for the foreseeable future. The current environment is characterized by three key drivers:
- Dovish US Monetary Policy: The market has fully priced in a 25-basis-point interest rate cut by the US Federal Reserve at its upcoming meeting. This expectation is fueled by a series of weak economic data, including a slowing labor market. Lower interest rates reduce the opportunity cost of holding non-yielding assets like gold, making it a more attractive store of value. Any hint from Fed Chair Jerome Powell of a more aggressive easing path could provide an additional boost to prices.
- Escalating Geopolitical Tensions: Global political instability continues to be a major catalyst for safe-haven demand. Resumed hostilities in the Russia-Ukraine conflict and an escalation of tensions in the Middle East have heightened market anxiety. In times of uncertainty, gold’s role as a reliable hedge against geopolitical risk becomes paramount, driving both institutional and private investor demand.
- Sustained Central Bank Buying: Central banks, particularly in emerging economies, are continuing their unprecedented gold purchasing spree. This trend, which began in earnest in 2022, is a strategic move to diversify away from the US dollar and into a tangible asset. This consistent, large-scale buying provides a solid floor for gold prices, absorbing any short-term dips and reinforcing its long-term value. According to recent data, central banks' purchases account for roughly a quarter of all gold demand, a powerful and unwavering force in the market.
The Outlook: What’s Next for Gold?
The combined effect of a robust technical setup and strong fundamental drivers suggests that gold's bullish run is far from over. While some short-term consolidation or minor pullbacks for profit-taking may occur, they are likely to be seen as buying opportunities by investors.
For our clients and partners at Gold Trade, Dubai, we recommend a "buy on dips" strategy. The current technical indicators suggest that any decline towards the $3,600 level could be a strategic entry point for investors looking to increase their gold allocation. Major global financial institutions, including UBS and Goldman Sachs, have recently revised their price targets, with some projecting gold could reach $3,800 an ounce by year-end and potentially $4,000 in 2026.
The current environment underscores gold’s enduring value as a cornerstone of a diversified investment portfolio. It serves not only as a hedge against inflation and currency debasement but also as a critical insurance policy against global economic and geopolitical uncertainties. As the world continues to navigate a turbulent period, gold shines brighter than ever, solidifying its place as a quintessential safe-haven asset.
« Back to News & Reports List