December 31, 2025
Gold Technical Analysis Report: 31 Dec 2025 – A Historic Year-End Recap and 2026 Forecast
Explore our comprehensive Gold Technical Analysis Report for 31 Dec 2025. Discover key XAU/USD support/resistance levels, fundamental drivers, and the 2026 outlook from Gold Trade, Dubai.
As the sun sets on 2025, the global financial landscape looks back at what can only be described as a "Golden Renaissance." For investors and traders at Gold Trade, this year has redefined the boundaries of the precious metals market. Gold (XAU/USD) didn't just break records; it shattered them, surging over 65% year-to-date to reach an astonishing all-time high of $4,550.11 per ounce in late December.
In this year-end technical analysis report, we dissect the price action of the final quarter, identify the structural shifts in the market, and provide a strategic roadmap for the opening weeks of 2026.
2025: The Year of the $4,500 Breakthrough
The journey of gold in 2025 has been fueled by a perfect storm of macroeconomic and geopolitical factors. While 2024 set the stage, 2025 saw the "de-dollarization" theme transition from a theoretical concept to a central bank reality.
Fundamental Catalysts
- The Federal Reserve Pivot: The Fed concluded the year with a final 25-basis-point rate cut in December, bringing the federal funds rate to a range of 3.50% to 3.75%. This easing cycle has significantly lowered the opportunity cost of holding non-yielding assets.
- Sovereign Debt Concerns: With U.S. national debt crossing the $41 trillion mark and interest payments exceeding $1.5 trillion annually, investors have flocked to gold as the ultimate "hard asset" hedge against currency debasement.
- Central Bank Accumulation: Led by the National Bank of Poland, the Reserve Bank of India, and the Central Bank of Brazil, official sector buying reached a fever pitch in Q4, providing a solid floor for every minor price correction.
Technical Analysis: XAU/USD Price Action
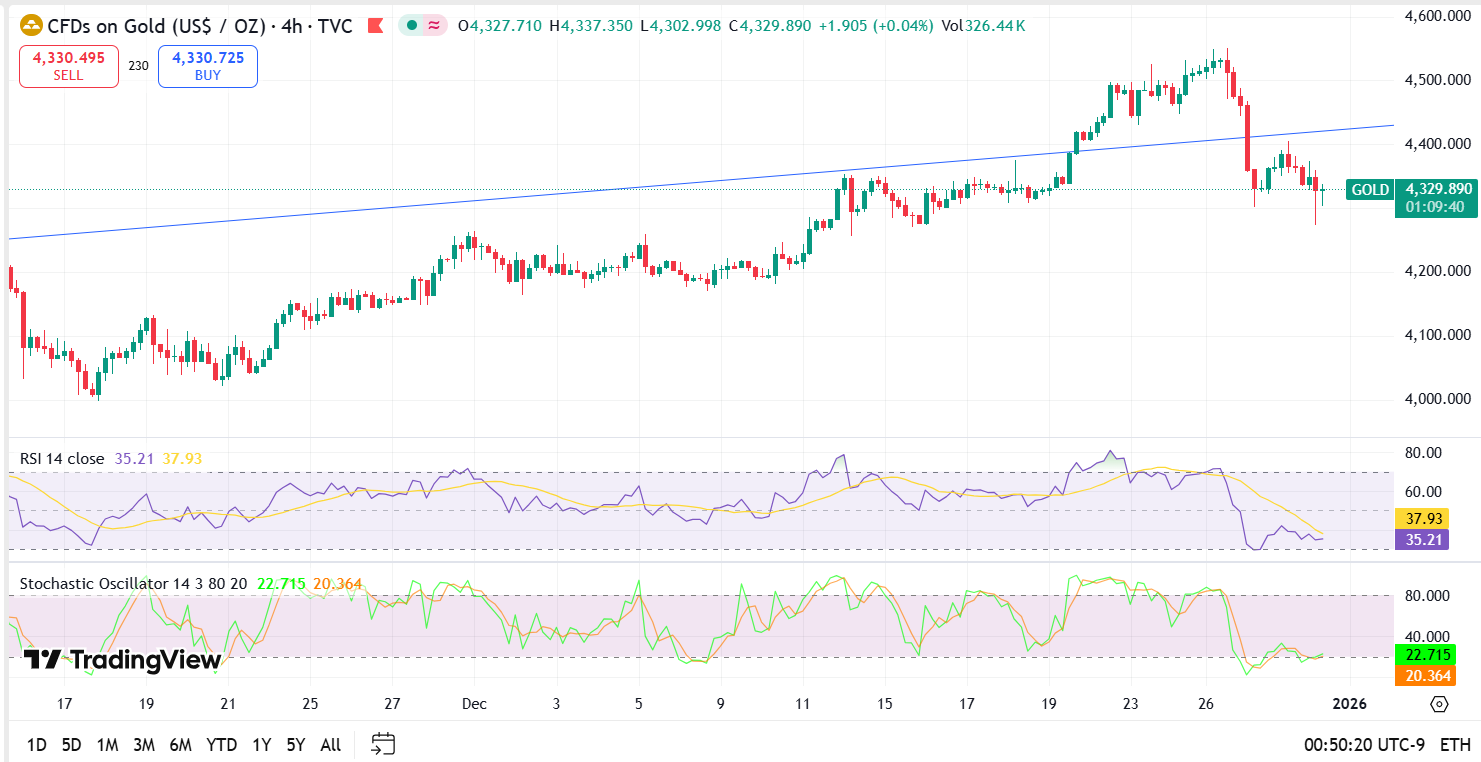
As of December 31, 2025, spot gold is trading near the $4,330 mark, consolidating after a sharp profit-taking move from the $4,550 peak.
The Daily Chart: Ascending Broadening Wedge
On the daily timeframe, gold has been navigating an ascending broadening wedge pattern. This formation typically indicates high volatility and a struggle between aggressive bulls and profit-taking bears.
Recently, the price corrected from the upper boundary of this wedge ($4,550) and is currently testing the mid-point support zone. A sustained hold above the EMA-65 (Exponential Moving Average) , which currently sits near $4,310, is crucial for maintaining the immediate bullish bias.
Key Technical Indicators
- Relative Strength Index (RSI): After spending most of October and November in "extreme overbought" territory (above 80), the RSI has finally cooled down to a healthy 58.5. This suggests that the "froth" has been removed from the market, leaving room for a new impulsive wave in early January.
- Moving Averages: The 200-day Simple Moving Average (SMA) remains far below current prices at approximately $3,650, highlighting the sheer strength of the 2025 bull run. The 50-day SMA at $4,180 serves as the primary "line in the sand" for the medium-term trend.
- Stochastic Oscillator: The lines are currently approaching the 20.0 (oversold) level on the 4-hour chart, hinting at a potential bullish crossover that could trigger a New Year's rally.
Strategic Support and Resistance Levels
For traders at Gold Trade, the following levels are critical for the first week of January 2026:
Immediate Resistance Levels
- $4,400 (Psychological Barrier): A break above this level is required to neutralize the recent corrective pressure.
- $4,515 (Post-Correction High): Reclaiming this level would confirm that the bulls are targeting the psychological $5,000 milestone.
- $4,550 (All-Time High): The ultimate ceiling of 2025.
Key Support Levels
- $4,300 - $4,320: The primary intraday support zone. A daily close below this could extend the correction toward the $4,250 region.
- $4,256 (Critical Structural Support): This level represents the lower boundary of the current ascending channel. A breach here could signal a deeper retracement toward $4,100.
- $4,180 (50-Day SMA): The "buy the dip" zone for institutional investors.
The Dubai Market Perspective
In Dubai, the "City of Gold," the local market has seen unprecedented physical demand. The premium for physical gold in the Dubai Gold Souk and at Gold Trade facilities has remained resilient, even as global spot prices fluctuated.
The interplay between the U.S. Dollar Index (DXY) —which ended the year weak at 97.80—and the local currency has made gold an exceptionally attractive investment for UAE-based portfolios. Furthermore, the massive 150% rally in Silver (XAG/USD) to $72.00 has created a "halo effect," drawing younger retail investors into the precious metals space through digital gold platforms and ETFs.
Market Sentiment and 2026 Outlook
The consensus among analysts at Gold Trade remains Structurally Bullish. While the 65% gains of 2025 are unlikely to be repeated in magnitude during 2026, the fundamental drivers—debt, geopolitical shifts, and lower interest rates—are still firmly in place.
"The correction we are seeing on December 31st is not a trend reversal, but a necessary 'breather' for a market that has run too fast. We expect gold to consolidate in the $4,200 - $4,400 range before making a concerted run toward $5,000 by Q3 2026." — Lead Analyst, Gold Trade, Dubai.
Risks to the Outlook
- Fiscal Policy Shifts: Potential changes in U.S. trade tariffs or a surprise stabilization in the U.S. deficit could strengthen the Dollar and pressure gold.
- Margin Requirements: Recent hikes in margin requirements by major exchanges (CME) may force highly leveraged traders to liquidate positions, causing "flash crashes."
Conclusion: Preparing for the 2026 Rally
As we close the books on a legendary year for gold, the technical structure remains intact. The pullback from $4,550 offers a strategic entry point for those who missed the mid-year surge. At Gold Trade, we recommend a disciplined approach, utilizing the $4,256 - $4,300 zone for systematic accumulation.
The era of cheap gold is firmly in the past. As we move into 2026, the yellow metal continues to prove itself as the world's premier safeguard of wealth.
Disclaimer: This report is for informational purposes only and does not constitute financial advice. Gold trading involves significant risk. Investors should conduct their own research or consult with a professional advisor at Gold Trade, Dubai, before making any investment decisions.
« Back to News & Reports List