February 17, 2026
Gold Technical Analysis Report: 17 Feb 2026 – Navigating the Critical $4,900 Support Zone
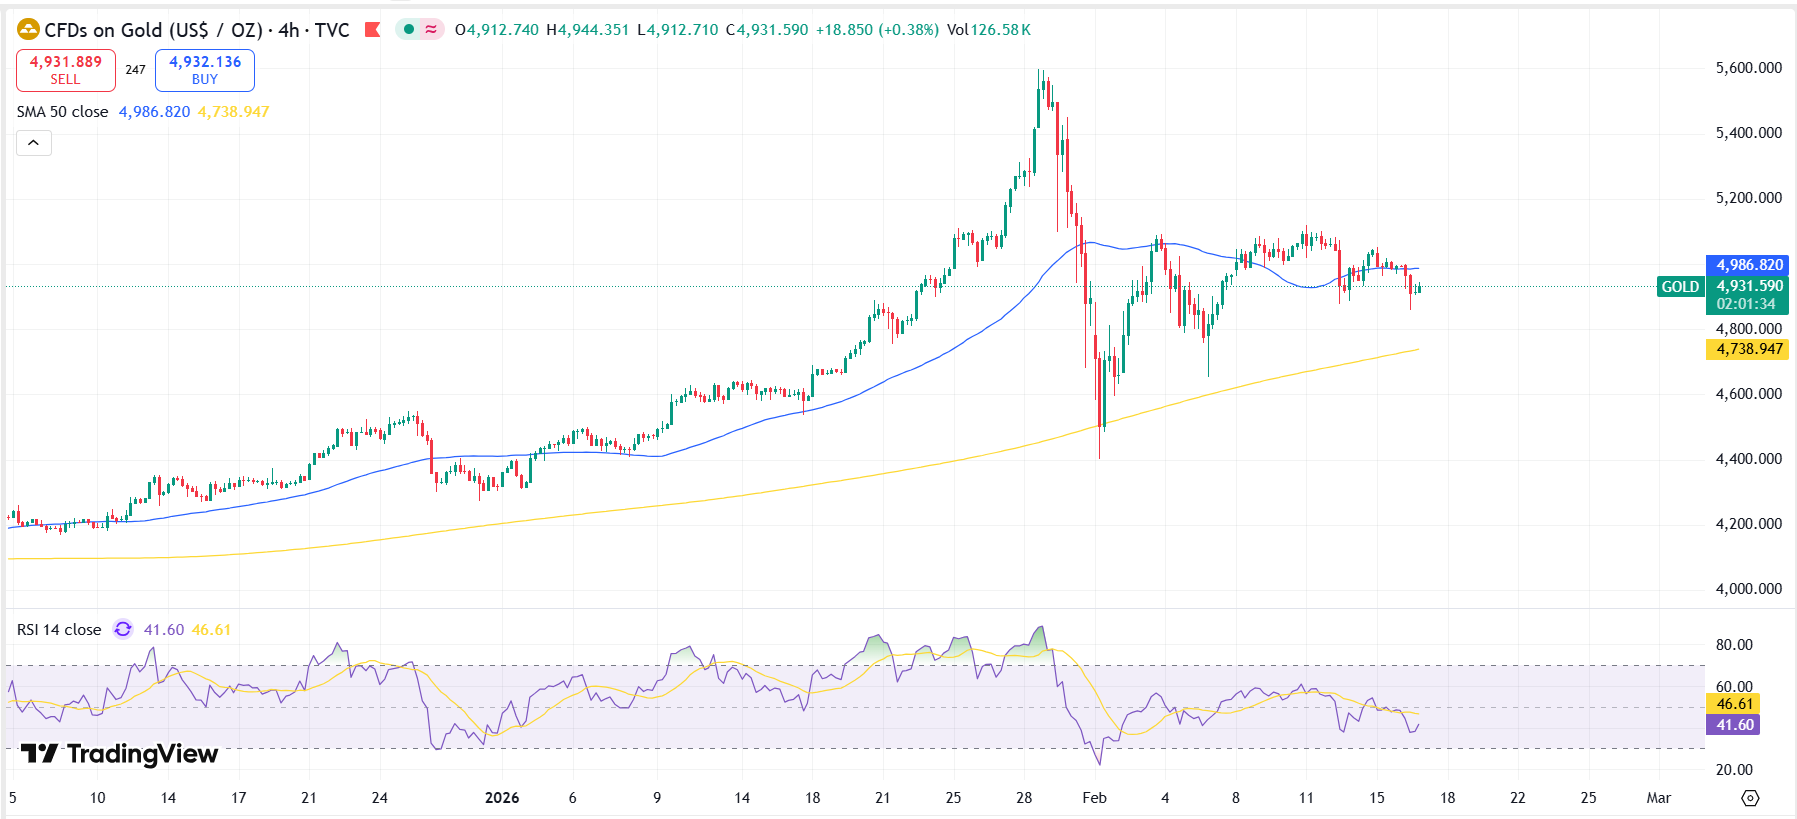
The global bullion market has reached a pivotal junction this Tuesday, February 17, 2026. Following a period of unprecedented historic highs and subsequent high-velocity volatility, Gold (XAU/USD) is currently undergoing a significant technical test. For investors and traders at Gold Trade, understanding these price dynamics is essential for navigating a market that is balancing long-term bullish structural trends against short-term corrective pressures.
As of today’s morning session in Dubai, spot gold is trading near the $4,911 mark, having touched intraday lows of $4,858. This price action comes as the market digests shifting expectations surrounding US monetary policy and a temporary easing of geopolitical tensions that had previously fueled the "safe-haven" premium.
Market Overview: The Post-2025 Landscape
To understand the current technical setup, one must look at the macro context. After a record-breaking 2025 that saw gold prices surge by nearly 65%, 2026 has introduced a "high-volatility plateau." The "yellow metal" is currently pinned near the 0.5 Fibonacci retracement level of the $4,402–$5,598 leg, signaling a state of equilibrium after the sharp corrections seen in early February.
Daily Dubai Gold Rates – 17 February 2026
In the local Dubai market, prices of gold bars remain competitive compared to international benchmarks, offering a strategic advantage for retail buyers and institutional investors alike.
| Purity | Price per Gram (AED) |
|---|---|
| 24K Gold | AED 589.75 |
| 22K Gold | AED 546.00 |
| 21K Gold | AED 523.50 |
| 18K Gold | AED 448.75 |
Technical Analysis: Key Levels to Watch
From a purely chart-based perspective, XAU/USD is currently coiling within a symmetrical triangle. This pattern is bounded by a rising trendline originating from the February low near $4,402 and a descending resistance line from the blow-off high of $5,598.
1. Support Zones: The "Line in the Sand"
The $4,900 level has emerged as the most critical psychological and technical floor for the current session.
- Immediate Support ($4,875 - $4,900): This zone is currently being actively tested. A sustained daily close below $4,900 would signal that the current consolidation is resolving lower.
- Secondary Support ($4,860): The 200-period Exponential Moving Average (EMA) sits near $4,860. As long as the price remains above this upward-sloping average, the broader long-term uptrend remains intact.
- Deep Structural Floor ($4,685): Should the $4,800 level fail to hold, technical analysts at Gold Trade anticipate a move toward the $4,685 region, which aligns with previous swing lows.
2. Resistance Levels: The Path to $5,000+
On the upside, gold faces a series of "supply ceilings" that must be breached to re-establish bullish momentum.
- Primary Resistance ($4,970 - $5,000): Sellers have aggressively defended the $5,000 psychological barrier. Intra-day momentum remains bearish as long as the market stays below this level.
- Key Breakout Zone ($5,100 - $5,141): This represents the 0.618 Fibonacci retracement. A decisive break and close above $5,150 would invalidate the current bearish structure and open the doors for a retest of $5,300 and potentially the $5,600 peak.
3. Momentum Indicators
- RSI (Relative Strength Index): The 14-day RSI is currently hovering in neutral-to-bearish territory. However, on shorter timeframes (4H), the indicator is approaching oversold conditions, suggesting a potential short-term "relief bounce" from the $4,875 support.
- Moving Averages: A minor "death cross" (50-period crossing below the 200-period) on the 4-hour chart has signaled a short-term bearish bias, urging caution for intraday "long" positions.
Fundamental Drivers: Why is Gold Volatile Today?
While technicals provide the map, fundamental data acts as the fuel. Several factors are influencing today's price action:
- FOMC Minutes Anticipation: Global investors are looking ahead to the release of the Federal Reserve meeting minutes on Wednesday. With US inflation cooling toward 2.4% and a resilient labor market, the "higher-for-longer" interest rate narrative is pressuring non-yielding assets like gold.
- The US Dollar (DXY) Strength: The Dollar Index has reclaimed strength above the 97 mark. Typically, a stronger USD makes gold more expensive for international buyers, leading to the current retreat in XAU/USD prices.
- Central Bank Demand: Despite the price dip, structural support remains. ANZ Bank and J.P. Morgan forecasts suggest that central banks are expected to purchase over 755 tonnes of gold in 2026, providing a "soft floor" for the market.
Expert Insight from Gold Trade: "The current dip toward $4,900 should be viewed as a healthy consolidation after the parabolic moves of last year. In Dubai, we see continued interest from long-term investors who recognize that even at these levels, gold remains an essential hedge against currency volatility and global debt levels."
Conclusion and Strategy for 17 Feb 2026
The technical outlook for February 17, 2026, suggests a market in search of a bottom. The path of least resistance currently points downward toward the $4,875 support area, but the long-term structural bull case remains defended by the 200-day moving average.
- For Traders: Look for signs of a reversal or a "double bottom" near $4,900 before considering long entries. A break below $4,850 suggests further downside toward $4,700.
- For Investors: The current stabilization near $4,900 offers a potential accumulation zone for those with a 6-to-12-month horizon, as many institutional forecasts still project a return to $5,400 - $5,800 by year-end.
Disclaimer: The information provided in this Gold Technical Analysis Report is for educational purposes only and does not constitute financial advice. Trading gold and precious metals involves significant risk. Investors should conduct their own research or consult with a professional financial advisor before making any investment decisions.
« Back to News & Reports List