January 22, 2026
Gold Technical Analysis Report – 22 Jan 2026: XAU/USD Faces Vital Pivot as Bulls Eye $5,000 Milestone
The global bullion market has entered a transformative phase as we reach the final stretch of January 2026. Following an explosive 12% rally in the first three weeks of the year, Gold (XAU/USD) is currently navigating a high-stakes technical correction. For investors and traders at Gold Trade, the current price action represents more than just a pullback; it is a critical re-evaluation of value as the metal tests the psychological and structural boundaries of the $4,800–$4,900 zone.
In this comprehensive technical analysis report for January 22, 2026, we dive into the moving averages, oscillator signatures, and the geopolitical catalysts shaping the "City of Gold’s" retail and institutional markets.
Market Snapshot: The State of XAU/USD
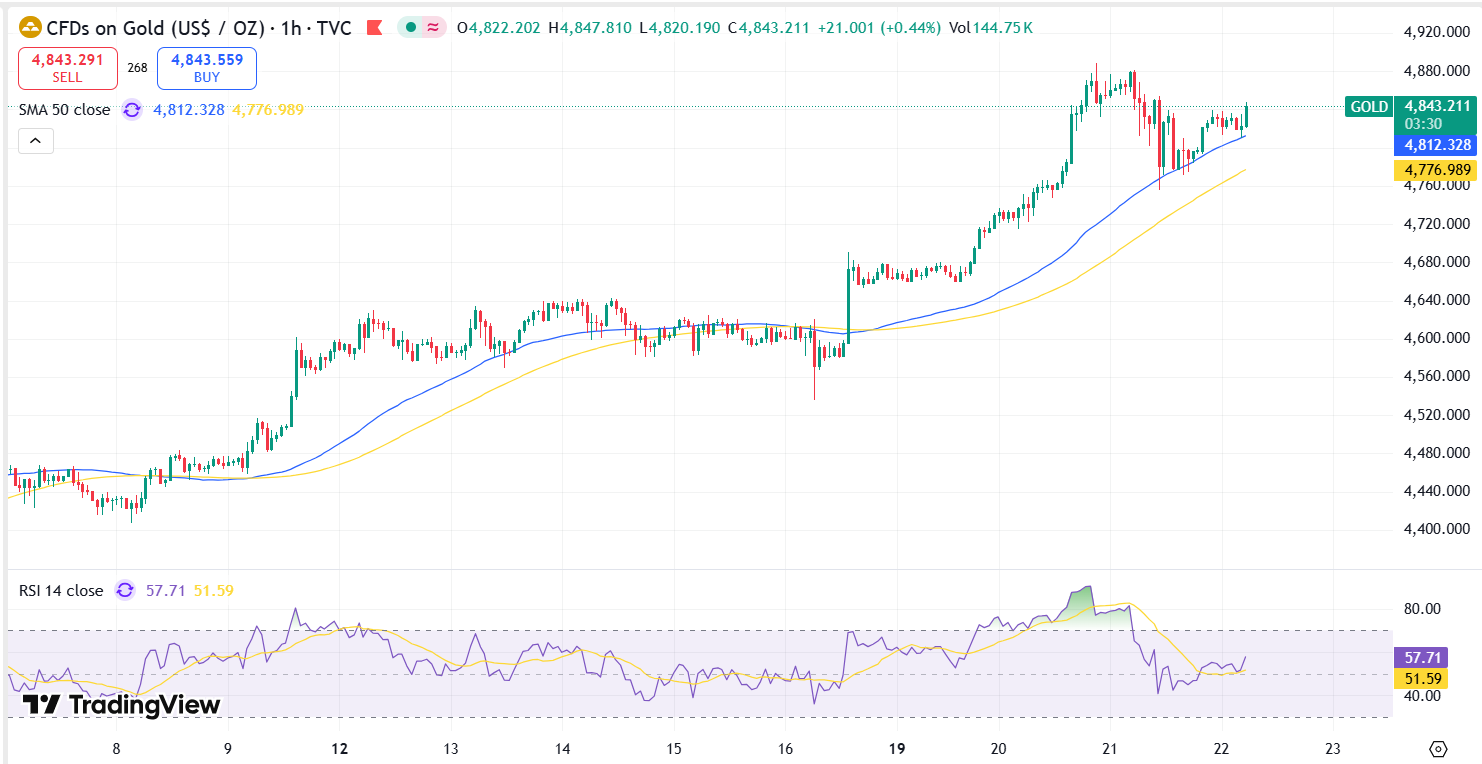
As of today’s trading session, Gold is hovering near $4,827 per ounce, reflecting a slight retreat from the recent All-Time High (ATH) of $4,888. This cooling-off period follows a year of unprecedented growth in 2025, where the metal surged 65% due to aggressive central bank diversification and shifting global trade dynamics.
Key Market Data (22 Jan 2026)
| Indicator | Value / Level | Sentiment |
|---|---|---|
| Spot Gold (XAU/USD) | $4,825.98 | Bullish (Correction) |
| Dubai 24K Gold Rate | AED 582.25/g | Strong Retail Demand |
| Dubai 22K Gold Rate | AED 539.00/g | High Volatility |
| RSI (14-Day) | 61 (Neutral-Bullish) | Unwinding Overbought |
| 50-Day EMA | $4,360 | Long-term Support |
Macro-Economic Catalysts: Beyond the Charts
The technical setup for January 22 cannot be viewed in isolation from the brewing macro-economic storm. Gold Trade analysts highlight three primary drivers currently fueling the volatility:
- Federal Reserve Uncertainty: Market participants are laser-focused on the upcoming FOMC meeting on January 29. While a rate hold is largely priced in (95% probability), the market is sensitive to any "verbal hawkishness" regarding inflation, which remains sticky at just below 3%.
- Geopolitical Risk Premiums: Tensions surrounding sovereign debt markets in Japan and trade disputes involving major economies have kept the safe-haven bid alive. Although some risk premium was shed early this morning—causing the dip to $4,780—the underlying structural demand remains robust.
- De-Dollarization & Central Banks: Emerging market central banks, led by Poland and Bolivia, continue to treat gold as a primary reserve asset. This institutional "backstop" ensures that deep corrections are met with aggressive buying, preventing a total trend breakdown.
Technical Analysis: Breaking Down the H4 and Daily Charts
1. The Pullback Strategy (H4 Timeframe)
On the 4-hour chart, XAU/USD formed a Bearish Engulfing pattern near $4,821, signaling that short-term sellers are taking control after the failure to breach $4,900. However, this is viewed by the Gold Trade technical team as a "liquidity rotation" rather than a bearish reversal.
The price is currently stabilizing in the $4,780–$4,800 area. This zone is crucial; it represents the equilibrium point between the recent impulsive leg and the current profit-taking phase. As long as the price maintains its integrity above the $4,760 support, the primary bullish structure is considered intact.
2. Moving Averages and Oscillators
- EMA Analysis: Gold remains comfortably above its 50-day and 200-day Exponential Moving Averages. The wide gap between the current price and the 200-day MA (near $3,800) suggests that while the trend is strong, the asset is historically stretched, making technical "breathers" necessary.
- RSI (Relative Strength Index): The RSI has exited the "extreme overbought" territory (above 70) and is now cooling at 61. This is a healthy sign for bulls, as it creates the necessary "room" for a potential secondary launch toward $5,000.
- MACD: The MACD histogram has begun to decline in positive territory. A bearish crossover would signal a deeper rotation toward the $4,650 support floor.
Dubai Retail Market: The "City of Gold" Perspective
In the heart of Dubai, the Gold Trade retail sentiment is split. The surge to AED 582.25 per gram for 24K has caught many seasonal buyers by surprise.
- The Wait-and-See Camp: Retail investors are increasingly looking for a "dip" toward AED 550 to re-enter the market.
- The Momentum Buyers: High-net-worth individuals and institutional players in the UAE are continuing to accumulate, fearing that if Gold shatters the $5,000 psychological barrier, the local price could quickly test the AED 600 per gram milestone.
Support and Resistance Levels (XAU/USD)
| Level Type | Price (USD) | Technical Significance |
|---|---|---|
| Major Resistance 2 | $5,000 | Psychological Cap / Q1 Target |
| Immediate Resistance 1 | $4,888 | All-Time High / Supply Zone |
| Pivot Zone | $4,820 | Current Balance Point |
| Immediate Support 1 | $4,760 | Bullish Correction Floor |
| Major Support 2 | $4,680 | 2025 Breakout Base |
The 2026 Outlook: Path to $5,400?
According to the latest institutional forecasts integrated into the Gold Trade analysis, the "base case" for 2026 remains aggressively bullish. Major global banks, including Goldman Sachs, have recently revised their year-end targets to $5,400.
For the immediate term, if Gold can close the week above $4,850, it would invalidate the current bearish divergence and pave the way for a test of the $5,000 level before the end of February. Conversely, a sustained break below $4,750 would suggest a more prolonged consolidation, potentially dragging prices back to the $4,550 region—an area that Gold Trade would view as a high-value "Buy the Dip" opportunity.
Conclusion: Strategic Advice for Investors
The technical landscape on January 22, 2026, suggests that Gold is in a "reload phase." The current correction from ATH is a healthy mechanism to flush out late-stage speculators and allow for long-term holders to consolidate their positions.
For our clients at Gold Trade, we recommend:
- Short-term Traders: Monitor the $4,760 level closely. A bounce here offers a high-reward entry with a stop-loss just below $4,745.
- Long-term Investors: Focus on the "Gold as a Hedge" narrative. Despite the volatility, the fundamental pillars of 2026—inflation, debt, and de-dollarization—remain the most potent catalysts in a generation.
Disclaimer: The information provided in this Gold Technical Analysis Report is for educational purposes only and does not constitute financial advice. Trading gold and precious metals involves significant risk. Investors should conduct their own research or consult with a professional financial advisor before making any investment decisions.
« Back to News & Reports List