February 18, 2026
Gold Technical Analysis Report – 18 Feb 2026: Navigating the $5,000 Threshold
Dubai, UAE – Feb 18, 2026 – As the global bullion market navigates a complex mid-quarter landscape, Gold Trade presents its comprehensive technical analysis for February 18, 2026. Following a historic surge that saw gold shatter records at the start of the year, the "City of Gold" remains the epicenter for traders looking to capitalize on the current price consolidation.
Today’s report dives into the key support levels, resistance barriers, and the macroeconomic catalysts—including the highly anticipated FOMC minutes—that are shaping the XAU/USD trajectory.
Market Snapshot: Gold’s Tug-of-War Below $5,000
As of early Wednesday trading, spot gold price is showing signs of a steady recovery, trading near $4,930 per ounce. This follows a volatile 48-hour window where prices dipped to a two-week low of $4,842, pressured by a resilient US Dollar and a recalibration of Federal Reserve interest rate expectations.
In the local Dubai market, retail rates have mirrored this international movement. 24K gold is currently holding firm just below the psychological Dh600 per gram mark, offering a strategic entry point for both investors and jewelry buyers ahead of the Ramadan season.
Key Technical Indicators at a Glance
| Indicator | Value / Status | Sentiment |
|---|---|---|
| Current Price | $4,930.25 | Neutral-Bullish |
| RSI (14) | 43.5 | Neutral (Oversold Recovery) |
| 100-Day SMA | $5,011.00 | Immediate Resistance |
| 200-Day SMA | $4,838.85 | Strong Support |
| MACD | Rising in Negative Zone | Weakening Bearish Momentum |
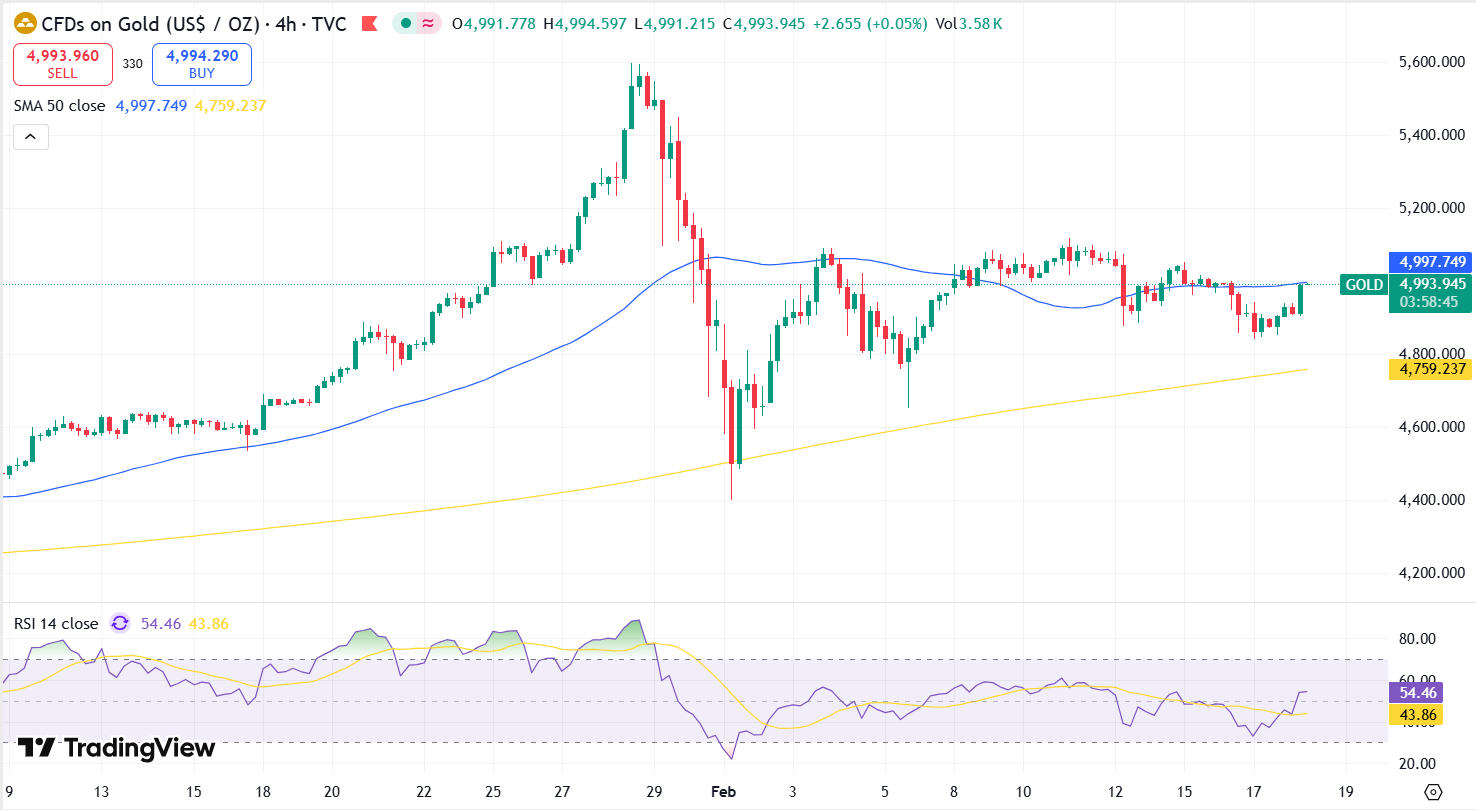
Technical Outlook: The "Rising Wedge" and Crucial Zones
The 4-hour (H4) chart reveals that gold is currently retesting the lower boundary of a Rising Wedge pattern. This formation is critical for determining the short-term trend for the remainder of February.
1. The Resistance Barrier ($5,000 - $5,115)
The primary challenge for bulls remains the psychological $5,000 level. Technical analysis shows a "confluence of resistance" near $5,011, where the 100-period Simple Moving Average (SMA) aligns with recent swing highs.
- Target 1: A sustained breakout above $5,050 would open the doors for a retest of the $5,115 peak.
- Target 2: Clearing the February 11 high of $5,140 could trigger a parabolic move toward the $5,265 Fibonacci extension level.
2. The Support Floor ($4,840 - $4,660)
On the downside, the $4,840 zone has proven to be a "line in the sand." This level is bolstered by the 200-period SMA.
- Immediate Support: $4,842 (Weekly Low).
- Critical Invalidation: A daily close below $4,800 would signal a shift in market structure, potentially leading to a deeper correction toward the $4,665 liquidity pool.
Expert Note from Gold Trade: "The current price action represents a healthy consolidation phase. While the 'Black Friday' reversal of late January is still fresh in traders' minds, the series of higher lows suggests the structural bull cycle remains intact."
Fundamental Catalysts: The Fed and the "Warsh Factor"
The technical setup today cannot be viewed in isolation from the macroeconomic backdrop. Markets are laser-focused on three primary drivers:
The FOMC Minutes & Interest Rates
The release of the Federal Reserve meeting minutes today is expected to provide clarity on the 2026 rate path. With the federal funds rate currently at 3.75%, any hint of a "dovish pivot" in the second half of the year will likely act as a fuel for gold. Conversely, hawkish rhetoric regarding persistent inflation could strengthen the USD and cap gold’s gains.
The New Fed Leadership
The nomination of Kevin Warsh as the next Federal Reserve Chair has introduced a new layer of "Fed Repricing." His reputation as a policy hawk has bolstered the US Dollar Index (DXY), creating a headwind for dollar-denominated bullion. Traders at Gold Trade are closely monitoring how the "Trump Tariff Policy" expectations might influence the Supreme Court decisions due on February 20.
Dubai Local Demand
In the UAE, the dip below Dh600 for 24K gold has triggered a surge in retail interest. Historical data suggests that "buying the dip" is a preferred strategy in the Dubai market, especially as central banks—led by emerging markets—continue to diversify their reserves into physical gold at a rate of roughly 850 tonnes per year.
Trading Scenarios for Feb 18 - Feb 20, 2026
Bullish Scenario (Buy Stop)
If gold consolidates above the $4,950 mark on high volume, it confirms that the recent dip was a "bull trap."
- Entry: Above $5,011.
- Take Profit: $5,150.
- Stop Loss: $4,940.
Bearish Scenario (Sell Stop)
If the FOMC minutes suggest a "higher for longer" interest rate environment, gold may break its current support.
- Entry: Below $4,840.
- Take Profit: $4,700.
- Stop Loss: $4,910.
Conclusion: A Balanced Outlook
As we look toward the final week of February, gold remains in a "wait-and-see" mode. The technical structure is mildly bearish in the very short term (H1/H4 timeframes), but the daily and weekly charts remain overwhelmingly bullish. For the savvy investor at Gold Trad, the current volatility provides a unique opportunity to build positions before the next projected leg up toward $5,400.
Disclaimer: The information provided in this Gold Technical Analysis Report is for educational purposes only and does not constitute financial advice. Trading gold and precious metals involves significant risk. Investors should conduct their own research or consult with a professional financial advisor before making any investment decisions.
« Back to News & Reports List