May 03, 2026
Gold Market Technical Outlook: Navigating the Post-Peak Landscape (May 04 –08, 2026)
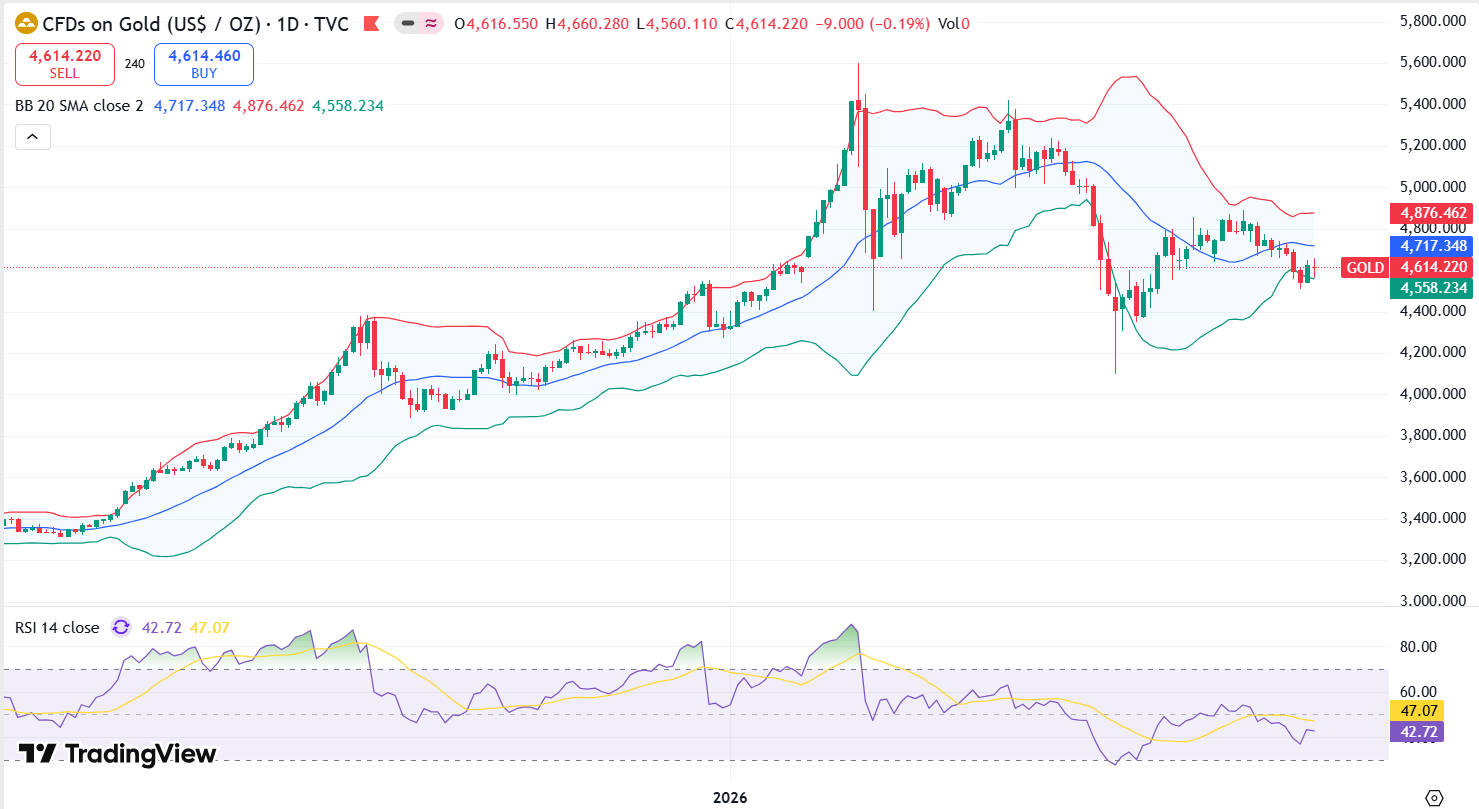
The global gold market enters the first full week of May 2026 positioned at a vital technical junction. After the historic milestone achieved on January 29, 2026, when spot gold surged to an unprecedented all-time high of $5,598.01, the market has undergone a significant "cooling off" period.
As of the close on Friday, May 1, 2026, spot prices settled at $4,614 per ounce. While this figure is substantially lower than the January peak, it reflects a necessary phase of price discovery. At Gold Trade, we view this $984 retracement not as a sign of weakness, but as a strategic consolidation phase where long-term value is currently being established.
Technical Landscape: Testing the $4,600 Floor
The current price action suggests that the market is attempting to carve out a definitive bottom. The transition from a parabolic rally to a stable trading range is a common characteristic of "Super-Bull" cycles.
Key Technical Benchmarks for the Week
| Technical Metric | Current Value/Level | Market Implication |
|---|---|---|
| Current Spot Price | $4,614 | Baseline for May Trading |
| 2026 Record High | $5,598.01 | Long-term Resistance Ceiling |
| Immediate Support | $4,585 | Short-term Defensive Line |
| Secondary Support | $4,510 | Major Structural Floor |
| RSI (Daily) | 42.8 | Neutral / Building Momentum |
The 14-day Relative Strength Index (RSI) has retreated from the extreme "overbought" zones of Q1 and is currently oscillating near 42.8. Historically, when gold hovers in the 40–45 range during a bull market, it indicates that the "weak hands" have exited, leaving room for institutional "smart money" to begin accumulating again in the Dubai physical markets.
Critical Price Levels to Watch: May 04 – 08
For investors looking to manage risk this week, the following price zones will serve as the primary roadmap:
1. The Psychological Barrier: $4,750
For a bullish reversal to be confirmed, buyers need to push the price back above the $4,750 mark. A daily close above this level would signal that the April correction has ended, likely inviting a surge of momentum buying toward the $4,900 handle.
2. The Tactical Pivot: $4,600
The $4,600 level is currently acting as a "gravity point." Throughout the upcoming week, we expect high-volume trading around this area. If the price maintains its footing here, it builds the necessary technical base to challenge higher resistance levels.
3. The Safety Net: $4,510
Should global dollar strength persist, gold may see a brief dip toward $4,510. Technical analysts at Gold Trade identify this as the 100-day Moving Average (MA) confluence zone. A test of this level would likely trigger significant "buy-on-dip" orders from sovereign wealth funds and bullion dealers.
Fundamental Catalysts and the Dubai Advantage
Beyond the charts, the fundamental backdrop for May 2026 remains supportive of gold’s status as the premier safe-haven asset:
- Macroeconomic Shifts: As global central banks navigate a "higher-for-longer" interest rate environment, the opportunity cost of holding non-yielding gold is being offset by currency devaluation in major fiat pairs.
- The Dubai Trade Hub: The UAE continues to see record-breaking physical gold turnover. The price of $4,614 is being treated by many local refineries and traders as an attractive entry point compared to the volatility experienced earlier this year.
- Geopolitical Resilience: In an increasingly multipolar world, gold remains the only asset without counterparty risk. This intrinsic value keeps the floor price significantly higher than pre-2026 levels.
Strategic Outlook for the Week
At Gold Trade, Dubai, we advocate for a balanced approach to the current market volatility:
- For Long-term Holders: The current consolidation below $5,000 represents a period of "healthy accumulation." Focus on the long-term trend rather than short-term fluctuations.
- For Active Traders: Look for signs of bullish divergence on the 4-hour charts near the $4,585 support zone. Initial upside targets should be conservatively placed at $4,690.
- Risk Management: With the market recalibrating after its $5,598 high, volatility remains elevated. Ensure all positions are backed by disciplined stop-loss orders to protect capital.
Conclusion: The Path Forward
The week of May 4, 2026, is about finding balance. Gold has transitioned from a period of euphoric gains to one of technical maturity. While the $4,614 price point is a far cry from the $5,598 peak, the underlying market structure remains robust.
At Gold Trade, we remain your trusted partner in the Dubai bullion market, providing the unique technical clarity required to thrive in this historic era for precious metals.
Disclaimer: This report is provided for informational purposes only. Gold trading involves substantial risk of loss and is not suitable for every investor. Past performance, such as the Jan 2026 high, does not guarantee future results.
« Back to News & Reports List