February 19, 2026
Gold Technical Analysis Report – 19 Feb 2026: Navigating the $5,000 Milestone
Welcome to the comprehensive Gold Technical Analysis Report for February 19, 2026, brought to you by Gold Trade. As the global "City of Gold" continues to serve as the epicenter for physical and digital bullion trading, today’s market price action has reached a critical technical and psychological juncture.
Following a historic rally in 2025 that saw the yellow metal surge past previous records, the first quarter of 2026 has introduced a new regime of high-frequency volatility. Today, spot gold price (XAU/USD) is battling for dominance around the $5,000 per ounce level, a threshold that is defining the next major trend for the year.
Market Overview: The Current State of XAU/USD
As of the Dubai morning session on Thursday, February 19, 2026, spot gold is trading near $5,007, marking a modest intraday gain of 0.6%. In the local Dubai market, 24K gold has reclaimed the AED 600 per gram mark, currently sitting at AED 601.75, while 22K gold is holding steady at AED 557.25.
The market is currently caught in a tug-of-war between two powerful forces:
- Bullish Drivers: Rising geopolitical tensions between the U.S. and Iran and a surge in safe-haven demand.
- Bearish Headwinds: A resilient U.S. dollar and a cautious Federal Reserve that is hesitant to proceed with further rate cuts in the face of strong industrial data.
Technical Analysis: Key Support and Resistance Levels
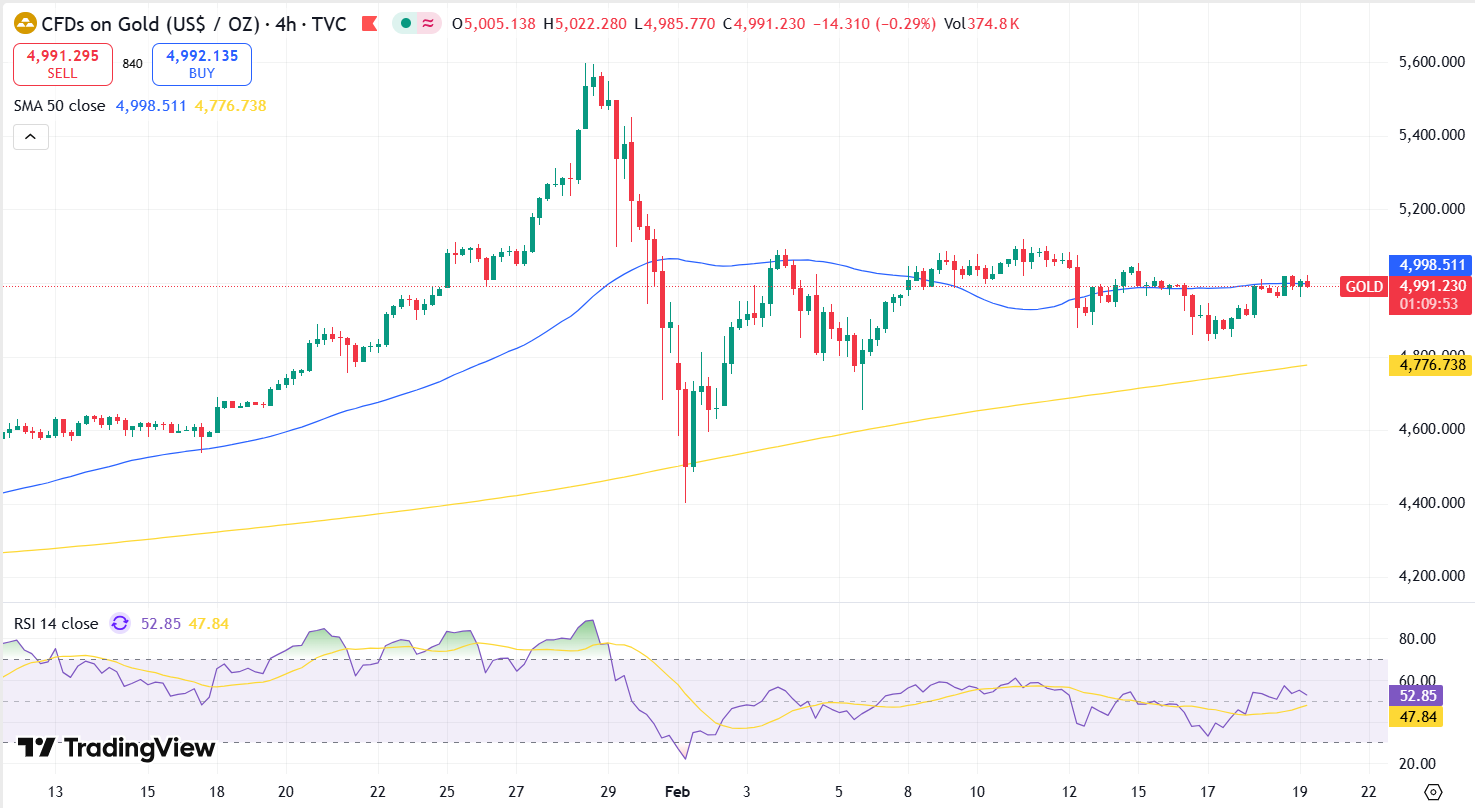
Technical analysts at Gold Trade have identified a narrowing "Symmetrical Triangle" pattern on the H4 (4-hour) charts. This suggests that a significant breakout is imminent. Below are the critical levels to watch for today’s trading session:
1. Resistance Zones (The Ceiling)
- Immediate Resistance ($5,045 - $5,080): This is the "Supply Zone" where sellers have historically stepped in over the last week. A move above $5,080 is required to confirm a bullish reversal.
- Major Breakout Target ($5,160): If gold sustains a close above $5,100, the path clears for a retest of the $5,160 level, aligning with the 0.618 Fibonacci retracement of the recent January sell-off.
2. Support Zones (The Floor)
- Primary Support ($4,945 - $4,970): Gold found significant dip-buying interest here yesterday. As long as the price stays above $4,945, the intraday bias remains cautiously optimistic.
- Critical "Line in the Sand" ($4,900): This is the most vital structural support. A daily close below $4,900 would invalidate the current recovery and could trigger a slide toward the $4,816 region.
3. Momentum Indicators
- RSI (Relative Strength Index): The 14-day RSI is currently at 54, indicating neutral momentum with a slight upward tilt. We are no longer in the "overbought" territory seen during the January peak of $5,595, suggesting there is room for a healthy move higher.
- Moving Averages: The price is currently hovering just above the 50-day EMA (Exponential Moving Average) . In technical terms, staying above the 50-day EMA is a bullish signal for short-term swing traders.
Fundamental Catalysts Impacting Gold in 2026
While the charts provide the map, fundamental news provides the fuel. Several key factors are influencing gold prices in Dubai and globally today:
Geopolitical Risk Premium
Speculation regarding U.S. military intervention in the Middle East has returned the "fear bid" to the market. Whenever geopolitical uncertainty rises, institutional investors in Dubai often pivot from equities to physical gold bars and coins, providing a solid floor for prices.
The Federal Reserve’s "Higher for Longer" Stance
Minutes from the latest FOMC meeting revealed a split among Fed officials. While some favor rate cuts to support growth, others are concerned about sticky inflation. A stronger-than-expected U.S. jobs report earlier today (Jobless claims at 206,000) has boosted the Dollar Index (DXY), which traditionally puts downward pressure on gold.
Central Bank Accumulation
A significant trend for 2026 remains the "De-dollarization" strategy of emerging market central banks. Analysts at J.P. Morgan and Goldman Sachs suggest that central banks are on track to purchase over 750 tonnes of gold this year. This structural demand ensures that even during price corrections, the long-term uptrend remains intact.
Gold Price in Dubai: A Snapshot for Investors
For our local clients at Gold Trade, the Dubai gold rate remains highly competitive due to the absence of import duties on bullion.
| Gold Purity | Price per Gram (AED) | Trend |
|---|---|---|
| 24K Gold | AED 601.75 | Bullish |
| 22K Gold | AED 557.25 | Bullish |
| 21K Gold | AED 534.25 | Bullish |
| 18K Gold | AED 458.00 | Bullish |
Analyst Note: "The return of 24K gold above AED 600 is a significant psychological milestone for retail buyers in the UAE. While some shoppers are adopting a 'wait-and-watch' approach, savvy investors are using these consolidation phases to accumulate gold ahead of the expected Ramadan and Eid-Al-Fitr demand surge."
Investment Strategy & Outlook for 19 Feb 2026
The technical outlook for today suggests a "Buy the Dip" sentiment as long as the $4,945 support holds.
- For Intraday Traders: Look for long entries near $4,980 with a target of $5,085 and a tight stop-loss below $4,940.
- For Long-Term Investors: 2026 is shaping up to be a year of "Healthy Consolidation." With many institutional forecasts still targeting $5,400 to $6,000 by year-end, current levels represent a strategic entry point for those looking to hedge against global currency debasement.
Conclusion
As we navigate the volatility of February 19, 2026, gold remains the ultimate store of value. Whether you are trading XAU/USD on a screen or purchasing physical 24K bars in Dubai, the technicals suggest that the current "rebalancing phase" is nearly complete. A decisive break above $5,100 could reignite the parabolic rally we witnessed last year.
Stay tuned to Gold Trade for daily updates, expert insights, and the most accurate gold rates in the UAE.
Disclaimer: The information provided in this Gold Technical Analysis Report is for educational purposes only and does not constitute financial advice. Trading gold and precious metals involves significant risk. Investors should conduct their own research or consult with a professional financial advisor before making any investment decisions.
« Back to News & Reports List