January 22, 2026
Silver Technical Analysis Report – 22 Jan 2026: XAG/USD Consolidates Near Record Highs as $100 Target Looms
The "White Metal" has officially stolen the spotlight from its yellow counterpart as we enter the fourth week of January 2026. While Gold remains a pillar of stability near $4,800, Silver (XAG/USD) has undergone a parabolic transformation, recently shattering decades-old resistance levels to trade in uncharted price-discovery territory.
As of today, January 22, 2026, analysts at Gold Trade are observing a critical consolidation phase. Following the surge to a fresh All-Time High (ATH) of $95.87 earlier this week, the market is catching its breath. For traders in the UAE and global institutional investors, the question is no longer if silver will reach triple digits, but when.
Market Snapshot: Silver’s Explosive Start to 2026
The first 22 days of 2026 have been nothing short of historic for silver. After ending 2025 with a staggering 150% gain, the metal has already added another 25% to its value this month.
Key Trading Data (22 Jan 2026)
| Indicator | Value / Level | Market Sentiment |
|---|---|---|
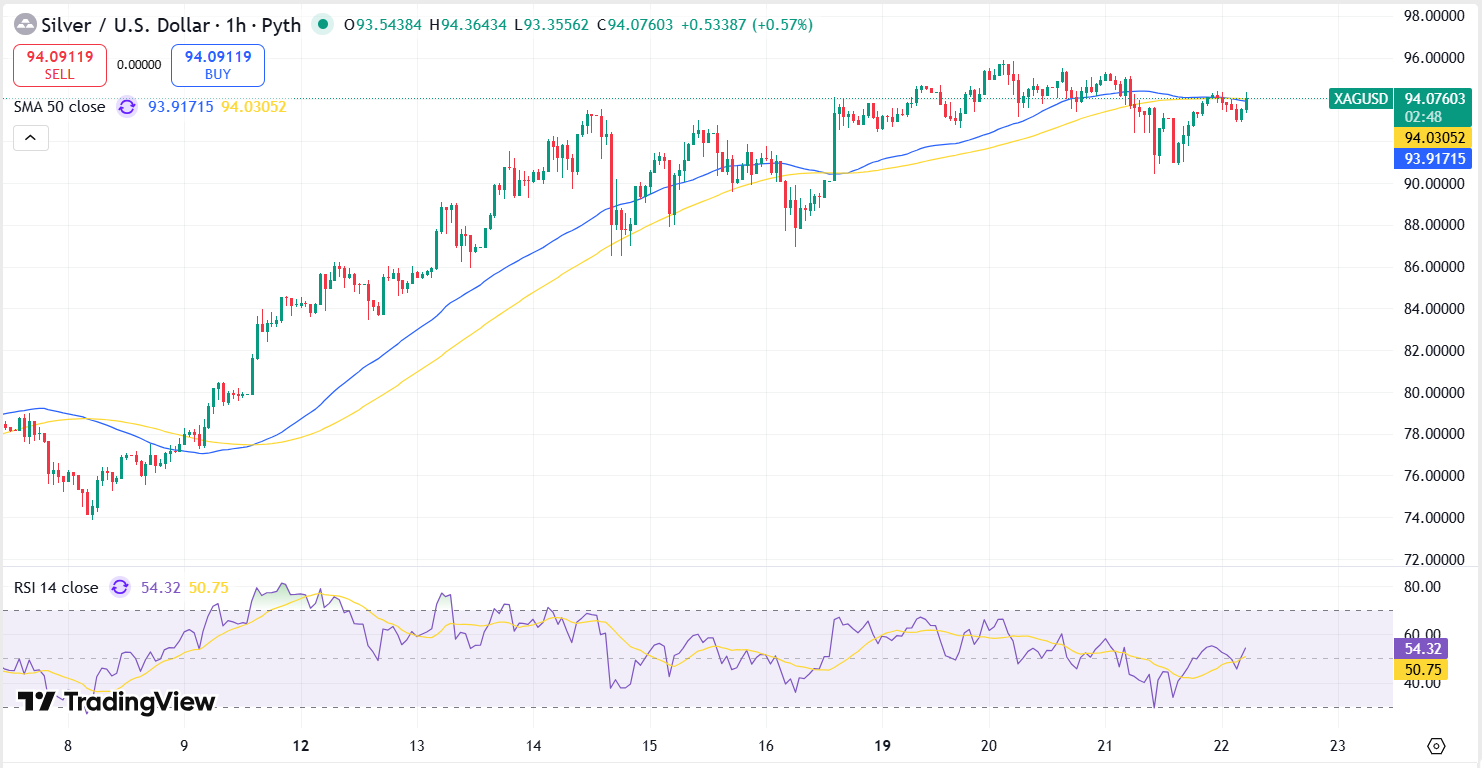
| Spot Silver (XAG/USD) | $92.45 | Bullish (Consolidation) |
| Dubai Silver Rate (999 Fine/kg) | AED 12,769 | Very High Demand |
| Gold/Silver Ratio | 52:1 | Significant Compression |
| 14-Day RSI | 68 (Neutral-Bullish) | Cooling from Overbought |
| 50-Day EMA | $74.20 | Strong Trend Support |
Fundamental Drivers: The "Perfect Storm" for Silver
At Gold Trade, we attribute this unprecedented rally to a convergence of industrial scarcity, geopolitical shifts, and a fundamental change in investor psychology.
1. The Industrial Backbone: AI and Green Energy
Silver’s dual identity as both a precious metal and an essential industrial commodity is the primary engine behind its current valuation.
- Solar PV Revolution: In 2026, global solar capacity is projected to reach 665 GW. The transition to high-efficiency n-type solar cells, which require significantly higher silver loading than older p-type cells, has pushed photovoltaic silver demand to an estimated 125 million ounces (Moz) annually.
- AI Data Centers: The explosion of Artificial Intelligence infrastructure has created a new, aggressive demand for high-conductivity silver components in server architecture and specialized semiconductors.
- EV Market Maturity: With electric vehicle production hitting 15 million units this year, the automotive sector is consuming roughly 75 Moz of silver for advanced circuitry and battery management systems.
2. Geopolitical Volatility: The Safe-Haven Surge
The early weeks of 2026 have been marked by heightened tensions. The ongoing dispute over trade and territory (notably the Greenland-Europe-US dynamics) and political shifts in Venezuela have sent investors scurrying for "hard money." In this environment, silver is being treated as a high-beta alternative to gold, capturing larger percentage gains as risk-aversion peaks.
3. Structural Supply Deficits
2026 marks the sixth consecutive year of a global silver supply deficit. Mine production from major hubs like Mexico and Peru has plateaued due to declining ore grades and rising operational costs. With China announcing new export licensing requirements for silver starting this year, the physical market is tighter than it has been in half a century.
Technical Analysis: Navigating the $90+ Territory
1. Fibonacci Extension and the $100 Milestone
Using the major 2025 swing low of $32.00 and the subsequent intermediate high of $72.00, we can project the current rally's trajectory.
- The 1.272 Fibonacci extension sits near $82.80, a level that acted as a launchpad last week.
- The 1.618 extension—often a target for impulsive waves—is mathematically positioned at $96.72.
The failure to decisively hold above $95 yesterday suggests that the $96.72 - $100.00 zone is currently guarded by heavy institutional profit-taking. However, as long as silver maintains its base above $88.00, the "measured move" toward $100 remains the high-probability scenario for Q1 2026.
2. Oscillator Signatures: RSI and MACD
On the Daily timeframe, the Relative Strength Index (RSI) hit a peak of 84 on Tuesday, indicating an extremely overbought condition. The current drift back to 68 is a healthy development, allowing the market to "reset" without breaking the uptrend.
The MACD (Moving Average Convergence Divergence) remains in positive territory, though the histogram is showing signs of deceleration. This suggests that the "easy money" phase of the January rally is over, and we are entering a phase of strategic accumulation where patience will be rewarded.
Support and Resistance Levels (XAG/USD)
| Level Type | Price (USD) | Technical Rationale |
|---|---|---|
| Major Resistance 2 | $105.00 | Historical Extrapolated Target |
| Immediate Resistance 1 | $95.87 | Current All-Time High |
| Pivot Zone | $92.50 | Intraday Equilibrium |
| Immediate Support 1 | $88.40 | Previous Breakout Structure |
| Major Support 2 | $84.00 | December 2025 Peak / Psychology |
The Dubai Advantage: Local Market Trends
In Dubai, the "City of Gold" is rapidly becoming a global hub for silver bullion. At Gold Trade, we have noticed a 40% increase in silver-linked exchange-traded products and physical bar demand compared to the same period last year.
- The Silver Souk Effect: Retail premiums in the Dubai market remain competitive, but stock levels for 1kg and 5kg fine silver bars are currently at record lows.
- Investor Sentiment: Local high-net-worth individuals are increasingly diversifying their "safe-haven" portfolios, moving from a 90/10 Gold-to-Silver ratio to a more aggressive 70/30 split. The belief is that silver’s catch-up play to its historical 15:1 ratio (currently 52:1) offers the greatest upside potential for the remainder of the decade.
Strategic Advice for Silver Investors
As we look toward the final week of January, the technical setup favors those who "buy the dips" rather than chase the highs.
- For Tactical Traders: Look for entries near the $88.00 - $90.00 support zone. A confirmed bounce on the H4 (4-hour) chart with a target of $95.50 provides an excellent risk-to-reward ratio.
- For Physical Holders: At current prices (approx. AED 12.77 per gram in Dubai), silver remains an essential hedge against currency debasement. While the price has tripled in 12 months, the structural deficit ensures that a return to sub-$50 levels is highly unlikely without a global economic reset.
- Risk Management: Silver’s volatility is its defining characteristic. We recommend using wide stop-losses or, better yet, building positions through "dollar-cost averaging" to mitigate the impact of the $5-$7 intraday swings that have become the new normal in 2026.
Conclusion: Is $100 the End or the Beginning?
The Silver Technical Analysis Report for 22 Jan 2026 highlights a market that is maturing into a primary macro asset. The breach of $90 was not just a speculative spike; it was the result of a "supply-demand squeeze" that has been years in the making.
While short-term profit-taking may pull prices back toward $84, the long-term trajectory remains firmly pointed toward the triple-digit milestone. For the clients of Gold Trade, the white metal represents the most asymmetric opportunity in the current commodity super-cycle.
Disclaimer: This report is for informational purposes only and does not constitute financial advice. Trading in precious metals involves risk. Always consult with a professional financial advisor before making investment decisions.
« Back to News & Reports List