January 21, 2026
Gold Technical Analysis Report: XAU/USD Bull Run Eyes $5,000 Milestone – Jan 21, 2026
The global gold market has entered a historic phase of price discovery as of Wednesday, January 21, 2026. Spot gold (XAU/USD) continues its relentless ascent, fueled by a "perfect storm" of geopolitical friction and domestic political uncertainty in the United States. For investors and traders at Gold Trade, the primary focus has shifted from "if" gold will reach $5,000 per ounce to "when."
As the "City of Gold" witnesses record-breaking retail demand, this technical analysis report breaks down the key price action, psychological barriers, and macroeconomic catalysts shaping today’s trading landscape.
Market Overview: The Greenland Standoff and Fed Uncertainty
Before diving into the charts, it is essential to understand the fundamental tailwinds driving today’s volatility. Gold prices surged toward fresh all-time highs of $4,876 during early European trading, a direct response to the escalating "Greenland Standoff." Tensions between the U.S. administration and European NATO allies over strategic territorial interests have rattled currency markets, sending the U.S. Dollar Index (DXY) tumbling toward the 99.00 level.
Simultaneously, the market is bracing for the U.S. Supreme Court hearing regarding the presidency’s efforts to remove Federal Reserve Chair Lisa Koch. This threat to central bank independence has fundamentally compromised the Dollar’s status as a primary safe-haven, leaving gold as the undisputed king of capital preservation.
Technical Analysis: Breaking Down the Bullish Structure
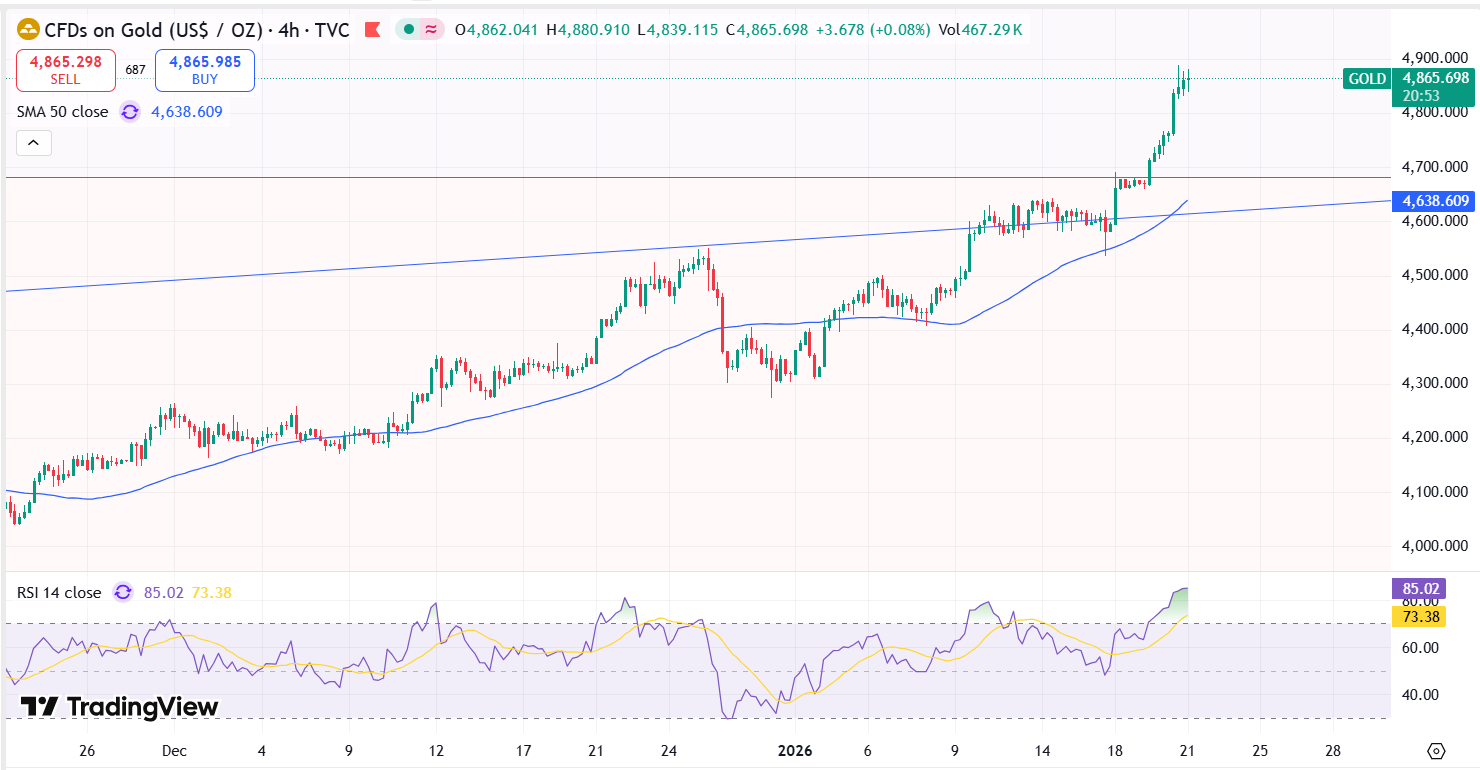
From a technical perspective, gold’s 2026 trajectory remains textbook bullish. After breaking out of a significant bull triangle consolidation in early January, the metal has maintained a steep ascending channel on the 4-hour and Daily timeframes.
1. Fibonacci Extensions and Support Zones
The current rally is finding significant structural support at the 2.618 Fibonacci extension level of $4,818. This level, which acted as a resistance ceiling last week, has now flipped into a "floor."
- Primary Support: $4,818 – $4,820 (The Fibonacci pivot).
- Secondary Support: $4,766 (The previous record peak and the EMA-20 retest zone).
- Tertiary Support: $4,720 (The lower boundary of the current ascending channel).
2. Moving Averages (EMA Strategy)
The EMA-50 and EMA-200 are trending sharply upward with a widening gap, signaling powerful momentum. On the hourly charts, gold is comfortably oscillating above the EMA-65, suggesting that any intraday dips are being aggressively bought by institutional players and central banks. For traders at Gold Trade, a "buy-on-dip" strategy remains the most viable approach as long as prices hold above the $4,750 mark.
3. RSI and Overbought Conditions
The Relative Strength Index (RSI) is currently hovering between 78 and 85 across multiple timeframes. While these levels traditionally indicate an "overbought" market, the absence of a bearish divergence suggests that the trend is backed by high-volume conviction rather than speculative froth. In a "runaway bull market," RSI can remain in overbought territory for extended periods as the market re-prices for a new economic reality.
Key Levels to Watch: Jan 21, 2026
For active traders in the Dubai market, the following price levels will define the sessions ahead:
| Level Type | Price (USD/oz) | Significance |
|---|---|---|
| Resistance 3 | $5,060 | The 1.618 extension of the current weekly swing. |
| Resistance 2 | $5,000 | Major psychological barrier and "Year 2026" target. |
| Resistance 1 | $4,925 | Immediate target for the current bullish impulse. |
| Current Spot | $4,876 | Trading at fresh all-time highs. |
| Support 1 | $4,818 | Crucial Fibonacci floor; must hold for bull continuation. |
| Support 2 | $4,766 | Strong demand zone (previous resistance). | Support 3 | $4,680 | Critical trendline support and the "line in the sand." |
The Dubai Perspective: Retail Trends and Investment Demand
In the heart of Dubai, the local market is mirroring the global surge. As of this morning, 24K Gold in the UAE has breached the AED 570 per gram mark. Despite these historic highs, Gold Trade has observed a unique shift in consumer behavior: "The Fear of Missing Out (FOMO)."
Investors who historically waited for corrections are now entering the market, fearing that the $5,000 threshold will be crossed before any meaningful retracement occurs. Furthermore, the Gold-to-Silver ratio is beginning to compress as silver also approaches its own record highs near $95, confirming a broader "super-cycle" in precious metals.
"The current market isn't just reacting to inflation; it's reacting to a total reshuffling of the global financial order," says a senior analyst at Gold Trade. "Dubai remains a hub for this transition, offering the liquidity and transparency required for large-scale wealth protection."
Strategic Outlook and Trade Idea
The path of least resistance for gold remains upward. The combination of de-dollarization, central bank accumulation, and geopolitical fragmentation creates a floor that prevents traditional "short-selling" from being effective in the current climate.
The "Bull Continuation" Scenario
If XAU/USD manages a daily close above $4,900, the technical path to $5,000 becomes clear. We expect a period of high volatility as the price approaches the $5,000 psychological handle, potentially involving a "liquidity grab" where prices spike momentarily before a healthy consolidation.
The "Correction" Scenario
A failure to breach $4,925 in the next 48 hours could lead to profit-taking. A retracement toward $4,766 would be considered a "healthy correction" and a prime entry point for long-term investors looking to increase their exposure before the next leg up.
Conclusion: Why Gold Trade, Dubai is Your Partner in This Bull Market
As we navigate the uncertainties of 2026, having a reliable thought partner is essential. Gold Trade provides real-time market insights, physical gold trading, and secure storage solutions tailored to the evolving needs of the modern investor.
Today's technical indicators are clear: the bull market is far from over. With the $5,000 target now in sight, the current consolidation near $4,870 represents a pivotal moment in financial history.
Disclaimer: The information provided in this Gold Technical Analysis Report is for educational purposes only and does not constitute financial advice. Trading gold and precious metals involves significant risk. Investors should conduct their own research or consult with a professional financial advisor before making any investment decisions.
« Back to News & Reports List