February 02, 2026
Gold Technical Analysis Report: 02 Feb 2026 – Navigating the "Historic Reversal"
The global bullion market has entered February 2026 with a level of volatility rarely seen in modern trading history. For investors and traders at Gold Trade , the current landscape represents a critical crossroads. After a meteoric rise that saw gold shatter records and cross the psychological $5,500 threshold just last week, the market is now grappling with a "historic reversal."
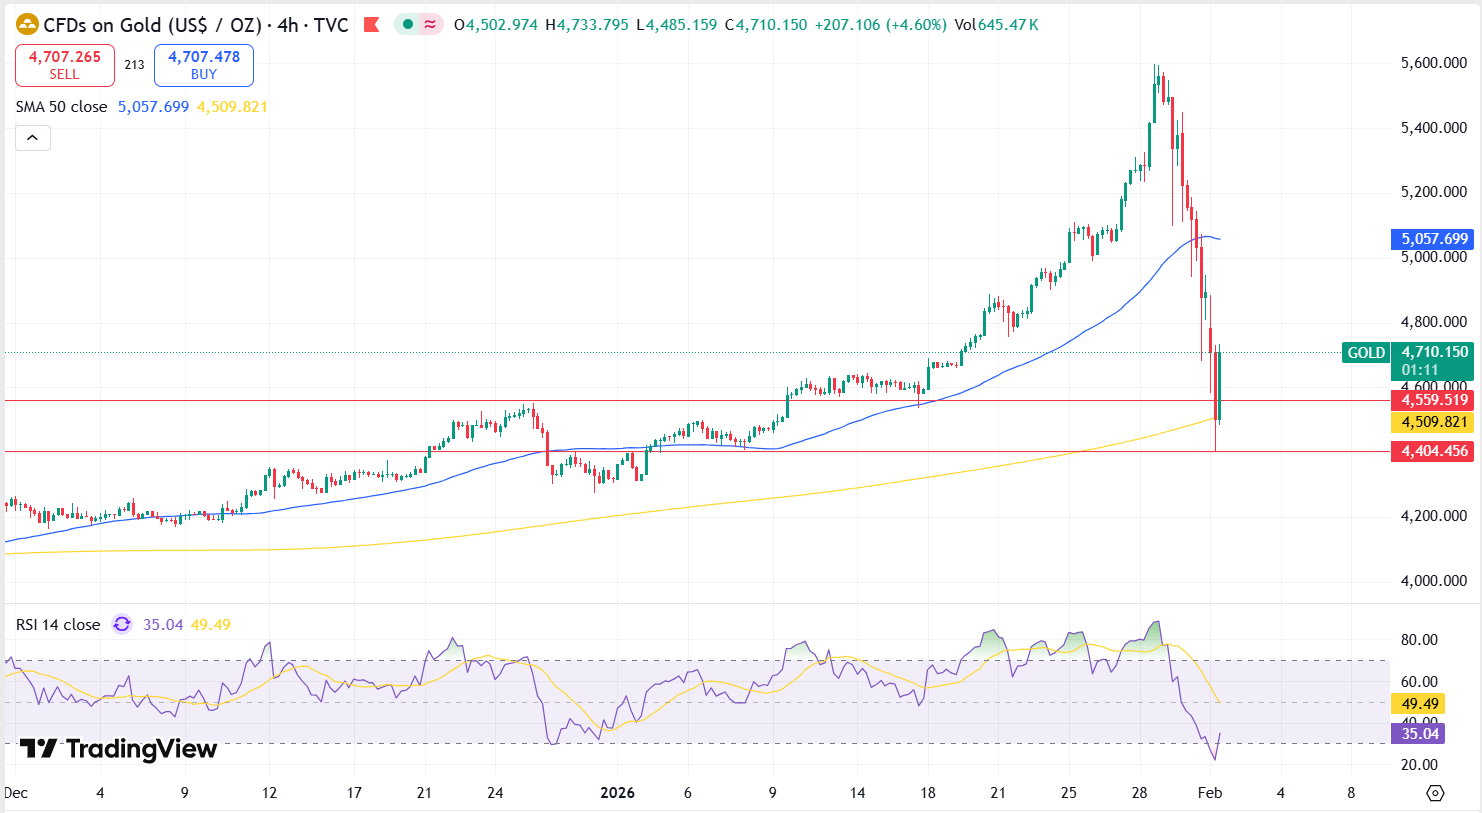
On this Monday, 02 February 2026, gold prices have extended their decline, sliding more than 4% in early trading to hover below the $4,700 mark. This follows a "Black Friday" session that marked the largest single-day loss on record for the precious metal.
The Macroeconomic Catalyst: The "Fed Repricing"
The primary driver behind this sudden shift in sentiment is the "Fed Repricing" triggered by political developments in the United States. Reports that the Trump administration plans to nominate Kevin Warsh—widely viewed as a hawkish choice—as the next Federal Reserve Chair have sent shockwaves through the currency and commodity markets.
Technical Analysis: Key Support and Resistance Levels
From a technical perspective, the "bullish trend line" that supported the rally throughout late 2025 has been decisively broken. However, the structure of the long-term upward channel remains a point of debate among analysts.
Critical Support Zones
As the pullback accelerates, technical strategists are looking at several layers of defense for the yellow metal:
- $4,600 (The 200-period MA): For the first time since November 2025, gold has dipped below the 200-period Moving Average on the 4-hour chart. Maintaining this level is crucial to prevent a lasting downtrend.
$4,550 - $4,604: This region is identified as the "medium-term bullish invalidation" zone. A sustained close below $4,604 would suggest the immediate bull run has been exhausted. $4,330 - $4,400: Today’s lows of $4,400 are being tested. If broken, a price "gap" exists down to $4,330, with the $4,000 psychological mark serving as the ultimate floor.
Immediate Resistance Levels
For a recovery to take hold, gold must reclaim the following territories:
- $5,000 (Psychological Barrier): A weekly close back above $5,000 is required to reignite momentum.
- $5,250 (20-period MA): This serves as the dynamic resistance that must be cleared to target previous highs.
- $5,520 - $5,615: This remains the major "confluence resistance zone" defined by Fibonacci extensions.
| Technical Indicator | Current Status | Market Sentiment |
|---|---|---|
| RSI (Relative Strength Index) | Oversold (<30) | Potential for technical rebound |
| Moving Averages (4H) | Below 200-MA | Bearish Momentum |
| Bollinger Bands | Trading outside lower band | Extreme Volatility |
| Trend Line | Broken (Bullish) | Structural Correction |
The Dubai Perspective: Local Market Impact
In Dubai, the "City of Gold," the local retail market is feeling the ripple effects of the global crash. After jumping by nearly Dh50 per gram in January, prices at the Dubai Gold Souk are now undergoing a "brutal reset."
Despite the price drop, the structural demand in the UAE remains robust. Retailers note that while the volatility has deterred some jewelry buyers, it has attracted "conviction buyers" looking to enter at more attractive price points. The weather in Dubai today—sunny with a high of 23°C—matches the clear-eyed, cautious optimism of local investors who view these corrections as "healthy resets" rather than a total trend reversal.
Is the Bull Run Over?
While the current correction is sharp, several structural "tailwinds" suggest the long-term outlook for gold remains constructive:
- Central Bank Accumulation: Emerging market central banks continue to diversify away from the dollar, providing a "strategic floor" under the price.
- Geopolitical Uncertainty: Tensions involving Iran and broader Middle East instability maintain gold's appeal as a safe haven.
- US Debt Concerns: With US public debt hovering around $37 trillion, the "debasement trade" remains a long-term theme for 2026.
Expert Insight: "Gold doesn't need a crisis to rise in 2026; it simply needs the world to behave the way it has been—with elevated debt and policy uncertainty. In this environment, gold doesn't chase fear; it absorbs it."
Conclusion for Investors
For those tracking the Gold Technical Analysis Report - 02 Feb 2026, the key takeaway is caution. The market is currently in a "price discovery" phase following a massive leverage-driven flush.
Investment Strategy for the Week:
- Monitor the $4,600 Support: Look for stabilization at this level.
- Watch the RSI: Since the RSI is currently in the oversold zone, a "dead cat bounce" or a legitimate technical rebound toward $4,850 is highly probable in the next 48 hours.
- Hedge with Physical Assets: Long-term holders should treat this 10-15% pullback as an opportunity to accumulate, as institutional positioning still has room to expand.
As we move deeper into February 2026, stay tuned to Gold Trade, Dubai for real-time updates and expert technical analysis to navigate this historic market shift.
Disclaimer: The information provided in this Gold Technical Analysis Report is for educational purposes only and does not constitute financial advice. Trading gold and precious metals involves significant risk. Investors should conduct their own research or consult with a professional financial advisor before making any investment decisions.
« Back to News & Reports List