September 20, 2025
Gold Technical Analysis Report: Navigating the Golden Path (22-26 September 2025)
Exclusive Report for Gold Trade, Dubai
DUBAI – As we enter the final week of September 2025, the global gold market (XAU/USD) finds itself at a pivotal juncture. After an unprecedented bullish run, the precious metal is showing signs of consolidation, leading to a dynamic week ahead for traders and investors. This unique technical analysis report, compiled exclusively for Gold Trade clients in Dubai, delves deep into the key price action, indicators, and support/resistance levels to watch from September 22nd to 26th.
Key Takeaways & Market Outlook
The past few months have been a golden age for bullion, with XAU/USD soaring to new all-time highs, propelled by a series of global economic shifts. The Federal Reserve's recent interest rate cut, the first of the year, coupled with geopolitical uncertainties and continued central bank buying, has created a formidable tailwind for gold prices. However, the momentum from this historic rally appears to be taking a strategic pause.
Our analysis indicates that while the long-term trend remains fundamentally bullish, the short-term outlook suggests a period of price discovery and potential correction. Traders should be prepared for increased volatility and a test of key support and resistance zones.
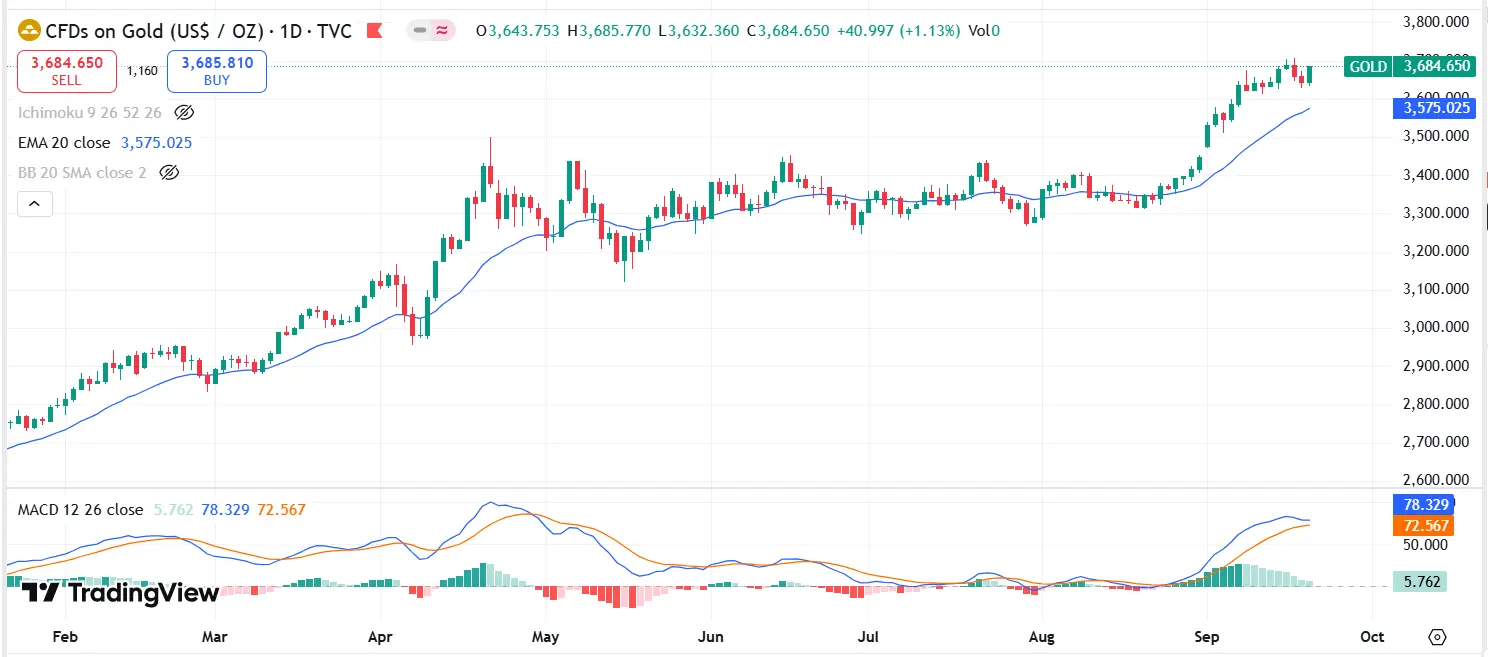
Technical Indicators in Focus
- Price Action and All-Time Highs: Gold recently touched a new record high, briefly surpassing the $3,700 mark before a wave of profit-taking brought it back to the current trading range. This is a classic market behaviour, where a major psychological level is tested, and an immediate pullback occurs as traders lock in gains. The failure to sustain the breakout above $3,700 highlights the short-term resistance at this level.
- Moving Averages: The daily and weekly moving averages tell a compelling story. The 50-day and 200-day Simple Moving Averages (SMAs) are in a clear bullish alignment, with the shorter-term average well above the longer-term one, signalling a strong uptrend. However, the current price is significantly stretched above these averages. This "over-extended" condition on the charts often precedes a mean-reversion move, where the price corrects back towards its moving average. A crucial level to watch is the 20-day Exponential Moving Average (EMA), which has served as dynamic support during previous pullbacks. A breakdown below this level could signal a deeper correction.
- Relative Strength Index (RSI): The RSI, a momentum oscillator, has been in overbought territory on the daily and weekly charts for an extended period. While not a direct sell signal, an RSI reading above 70 indicates that the asset has been bought too aggressively and is ripe for a correction. The recent move down from the all-time high has caused the RSI to cool off slightly, but it remains in a high-risk zone for new long positions. A re-entry into a more neutral range (between 30 and 70) would be healthier for the next leg of the rally.
- MACD (Moving Average Convergence Divergence): The MACD histogram, which measures the difference between the two moving averages, shows a slight weakening of bullish momentum. A potential bearish crossover (where the MACD line crosses below the signal line) on the shorter-term charts would be a significant indicator of a short-term trend reversal.
Key Support and Resistance Levels for the Week
Resistance:
- $3,685 - $3,700: This is the immediate and most significant resistance zone, encompassing the recent all-time high. A decisive breakout and sustained close above this level is required to confirm the continuation of the parabolic rally.
- $3,735: A break above $3,700 would likely target this next major resistance level, based on Fibonacci extensions and historical price projections.
Support:
- $3,640 - $3,660: This zone represents a minor support level formed by recent price consolidation. A breakdown here could accelerate selling pressure.
- $3,580 - $3,600: This is a crucial psychological and technical support zone. It acted as a strong resistance in the past and is now expected to serve as a solid floor. A hold at this level would reinforce the bullish structure of the market.
- $3,500: The most significant support level for the week. A breakdown below $3,500 would likely invalidate the short-term bullish thesis and could lead to a deeper correction toward the next major support around $3,450.
Trading Scenarios for the Week Ahead
Bullish Scenario: Gold holds its ground above the $3,600 support level. A strong catalyst, perhaps a dovish comment from a Fed official or new geopolitical tensions, could trigger a fresh wave of buying. A successful breakout above $3,700 would open the door for a swift move to $3,735 and beyond.
Bearish Scenario: The current profit-taking intensifies, breaking the $3,600 support. The price could then slide towards the critical $3,500 level. Such a correction would be a healthy development for the long-term trend, flushing out over-leveraged long positions and providing a more attractive entry point for investors.
Consolidation Scenario: This is the most likely outcome. The price will oscillate between the immediate resistance at $3,700 and the support at $3,600. Traders would look to "buy the dips" near support and "sell the rallies" near resistance, taking advantage of the range-bound market.
The Gold Trade Advantage: Dubai’s Hub for Precious Metals
As a leading gold company in Dubai, Gold Trade offers its clients unparalleled access to the global gold market. Our unique position at the heart of the world's premier gold trading hub allows us to provide real-time, data-driven insights. While this report focuses on the technical aspects of the market, our team understands that fundamental drivers such as a weak US Dollar, inflation concerns, and robust central bank purchases are the bedrock of gold's long-term strength.
For investors seeking to capitalize on this week's potential volatility, Gold Trade provides tailored services, from physical gold bullion and coins to comprehensive trading platforms for XAU/USD. Our commitment is to equip our clients with the knowledge and tools needed to navigate the complexities of the precious metals market successfully.
Important Disclaimer: This report is for informational purposes only and does not constitute investment advice. Gold trading involves significant risk, and past performance is not indicative of future results. We strongly advise all traders to conduct their own due diligence and consult with a professional financial advisor before making any investment decisions.
« Back to News & Reports List