September 29, 2025
Navigating the Golden Corridor: Analysis and Outlook for Gold (29 Sept - 03 Oct 2025)
The Dawn of a New Quarter: Focus Shifts to Inflation and the Fed’s October Stance
As the global market transitions from the final week of September into the nascent days of the fourth quarter, the precious metal complex remains the focal point of investor strategy. For our clientele in Dubai, the world’s preeminent physical gold trading hub, the week of 29 September to 03 October 2025 is set to be a pivotal period, offering both high-level volatility and strategic opportunities.
Gold has not merely held its ground but has surged to historic highs, with prices consistently trading above the $3,750 per ounce mark, propelled by a potent cocktail of dovish central bank policy, geopolitical fractures, and relentless central bank accumulation. The question now is whether the momentum can be sustained as the market digests the full implication of the US Federal Reserve's recent rate cut and anticipates the next critical moves.
This comprehensive report delves into the core economic, technical, and geopolitical factors that will shape the price action of gold (XAU/USD) over the upcoming trading week, providing the sophisticated analysis required for navigating the modern gold market from the heart of the UAE.
Macroeconomic Catalyst: The Pivot to October Monetary Policy
The principal driver of gold’s current strength is the undeniable shift in US monetary policy. The Federal Reserve's decision earlier in September to execute its first rate cut of the year, reducing the federal funds rate to a range of 4.00% to 4.25%, has been a major inflection point. This move, framed as a "risk-management cut" in response to a softening labour market despite persistent inflation, has significantly reduced the opportunity cost of holding non-yielding assets like gold.
The Data Drip-Feed: The week ahead lacks a single, earth-shattering economic data release, which in itself shifts the market's focus. Traders will now be keenly interpreting the collective "drip-feed" of lower-tier data, looking for clues that either confirm or contradict the Fed’s dovish tilt.
- Manufacturing and Services PMIs: Attention will be paid to global and US Purchasing Managers' Index (PMI) data. Any material weakness here would reinforce the narrative of a slowing global economy, thus increasing the probability of a further rate cut at the Fed's upcoming October meeting. This would be profoundly bullish for gold.
- The October Rate Cut Pricing: Following the September move, market probability now heavily leans towards at least one, and potentially two, more 25-basis-point cuts by the end of 2025. The data released this week will either solidify the expectation for an October cut, which would continue to suppress the US Dollar and boost gold, or introduce a degree of caution.
The critical variable remains real interest rates. As long as persistent US core inflation (which remains stubbornly elevated) is greater than the nominal yield on short-term US debt (which is falling due to rate cuts), the environment of negative real rates will provide a strong, structural tailwind for gold prices. Any data that widens this negative gap will act as an immediate catalyst for further upside.
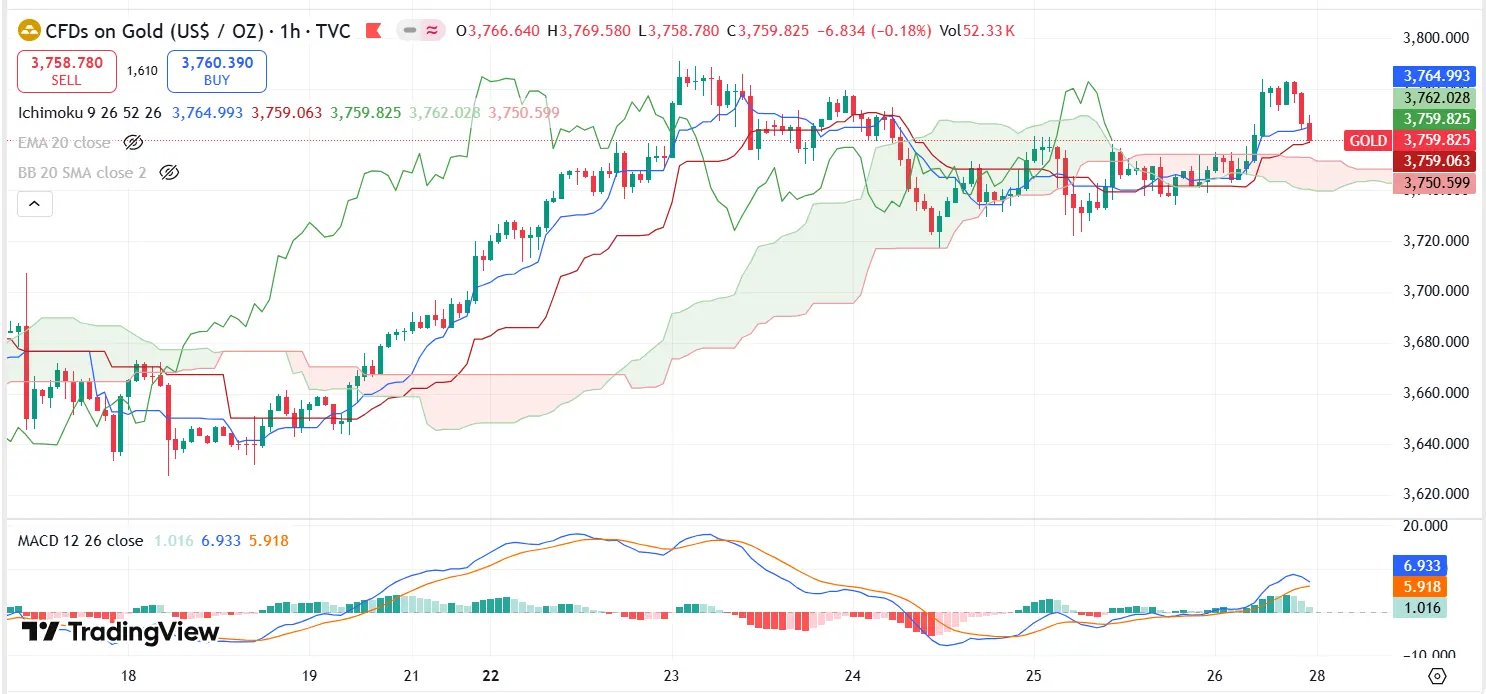
Technical Thermostat: Assessing Resistance and Consolidation
Gold’s technical chart has entered a phase of consolidation following the recent parabolic move that saw it reach a record high near $3,791 per ounce in the previous week. This consolidation is a healthy sign, preventing an overheated market and setting the stage for the next leg higher.
Key Levels to Watch (29 Sept – 03 Oct 2025):
| Indicator | Price Level (USD/oz) | Significance |
|---|---|---|
| Primary Resistance | $3,800 - $3,820 | Psychological barrier and short-term target. A decisive break suggests a move towards $3,900. |
| Near-Term Support | $3,700 - $3,720 | The low of the post-Fed pullback and a major psychological level. Holding this is key to maintaining bullish momentum. |
| Major Support | $3,620 - $3,650 | Strong technical floor representing a significant prior resistance zone. A break below here would signal a deeper correction. |
The Relative Strength Index (RSI) , while having retreated slightly from the overbought territory reached during the peak of the rally, still suggests a strong underlying bullish momentum. The favoured trading strategy for this week is "buy the dips," particularly if prices test the $3,700-$3,720 support zone. Traders should be cautious of profit-taking volatility around the resistance zone, which could lead to sharp, short-term pullbacks. The overall trend remains unequivocally bullish, but price discovery at these elevated levels naturally introduces greater volatility.
The Global Safety Net: Geopolitics and De-Dollarization
Beyond the charts and economic calendars, the structural support for gold stems from two persistent, long-term trends: geopolitical risk and the global movement towards de-dollarization. These factors are particularly relevant to the Dubai market, which serves as a nexus for both Eastern and Western capital.
- Persistent Global Instability: From ongoing conflicts to renewed trade tariff threats and political instability in various regions, the world remains characterized by high uncertainty. This environment consistently drives capital into the safe-haven asset par excellence: gold. Any unexpected escalation in global flashpoints could trigger an immediate, sharp risk-on move into bullion.
- Central Bank Accumulation: The most robust structural support comes from the official sector. Central banks worldwide, led notably by major emerging economies, have been aggressively diversifying their foreign reserves away from the US Dollar and into gold. This trend is driven by a desire for geopolitical hedging, a response to the weaponization of the US financial system, and concerns over the long-term devaluation of fiat currencies. This non-commercial demand creates a solid price floor, ensuring that any significant dips are met with substantial institutional buying interest. The UAE, as a major gold transit and storage hub, is a direct beneficiary of this global strategic shift.
Dubai’s Edge: Physical Demand and Strategic Positioning
The current price strength has done little to dampen the long-term appetite for physical gold in the Middle East and Asia. Dubai’s gold market remains highly active. While some local buying might be deferred due to the record-high US Dollar price, the underlying regional demand, supported by high liquidity and a cultural affinity for the metal, provides a necessary counter-balance to Western speculative trading.
Furthermore, the UAE's position as a gateway between global financial markets and the burgeoning Asian and African economies means it is strategically placed to benefit from the de-dollarization trend. As central banks and high-net-worth individuals seek secure, accessible, and regulated locations for physical gold storage and trade, Dubai's prominence is only set to increase.
Final Outlook: Bullish with Tactical Caution
For the week of 29 September to 03 October 2025, the outlook for gold remains constructively bullish. The fundamental landscape of expected US interest rate cuts, sticky inflation, and enduring safe-haven demand is overwhelmingly supportive. While the absence of a major data event might lead to a period of technical consolidation, traders and investors should view any resulting pullbacks towards the $3,700 support as tactical buying opportunities.
The overarching theme for the close of 2025 is the pursuit of real return and capital preservation in an uncertain world. Gold, trading at record levels, is a testament to this global quest, and its trajectory continues to point toward further appreciation. Vigilance and a focus on the key technical support zones will be the hallmarks of a successful trading strategy this week.
« Back to News & Reports List