September 29, 2025
Gold Technical Analysis Report: XAU/USD Breaks $3,800, Eyeing the $4,000 Horizon
Gold Trade, Dubai – September 29, 2025 – The closing days of September 2025 mark a historic acceleration in the gold market. The relentless bullish momentum that defined the third quarter has culminated in a decisive breach of the $3,800 per ounce barrier, setting a fresh all-time high for XAU/USD. As the global investment community transitions into Q4, the focus shifts from if gold can rise further to how far and how fast.
This Gold Technical Analysis Report from Gold Trade, Dubai, provides an essential deep dive into the technical structure of the rally, identifying critical support, resistance levels, and the momentum indicators guiding the next stage of this Golden Bull Run. For savvy investors seeking safe-haven gold investment opportunities, understanding these technical signposts is paramount to navigating the path toward our ambitious Gold Price Prediction 2025 targets.
The Macro-Technical Nexus: Why the Charts Remain Bullish
Gold's spectacular chart pattern is not occurring in a vacuum; it is underpinned by extremely supportive fundamental tailwinds. The most significant structural driver remains the dovish pivot by the US Federal Reserve. With markets currently pricing in a high probability of a further rate cut in October, the appeal of non-yielding gold continues to soar. This policy easing directly contributes to a weaker US Dollar Index (DXY) and lower real yields, reducing the opportunity cost of holding physical bullion.
Geopolitical tensions and persistent global economic uncertainty further solidify gold’s role as the asset of choice for de-risking. This flight to safety, combined with the unprecedented, sustained Central Bank gold buying—particularly from Asian and Middle Eastern institutions—provides a powerful, non-speculative demand floor that reinforces the technical breakouts seen on the daily and weekly charts. The technical picture, therefore, acts as a reflection of a fundamental, long-term shift in global monetary preferences.
Charting the New Frontier: Key Price Action and Levels
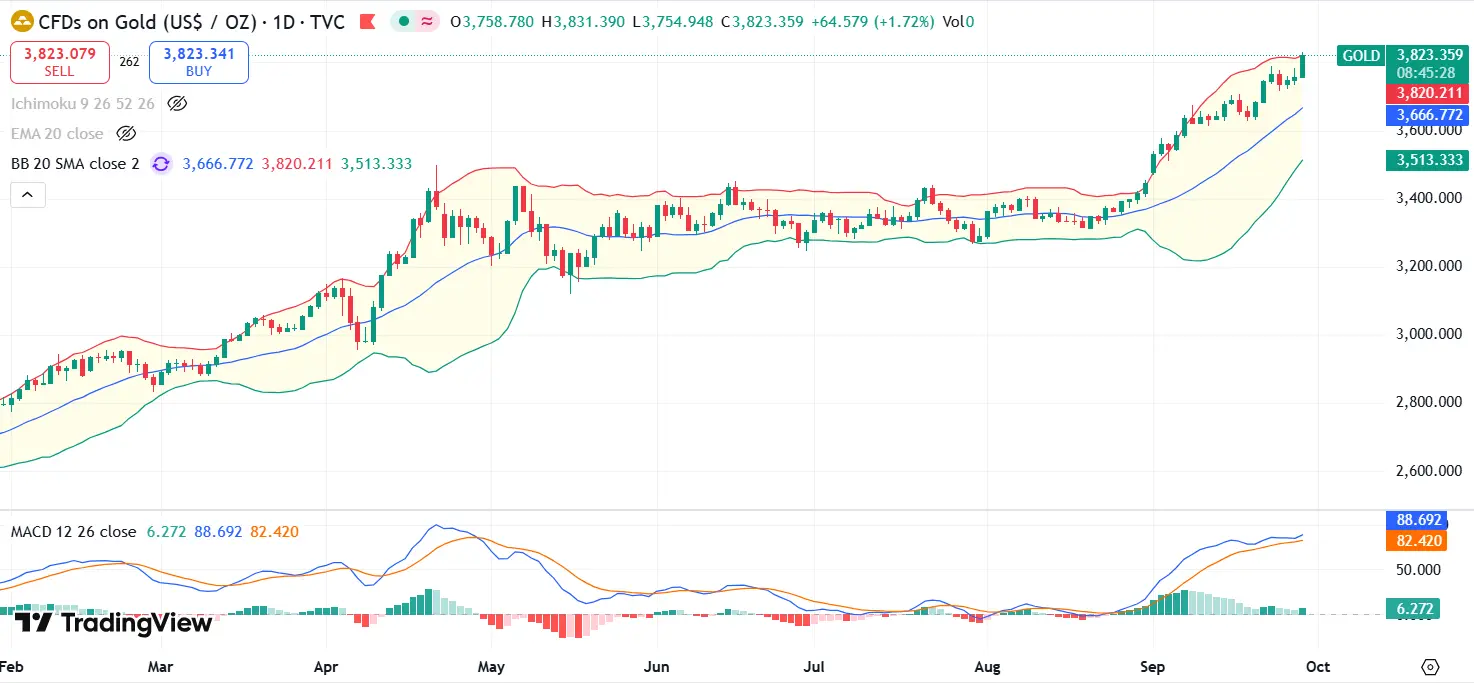
As of the morning of September 29, 2025, Gold (XAU/USD) is trading in uncharted territory, consolidating just above the newly established psychological mark of $3,800. This breakout is crucial, as the momentum driving the price action exhibits key characteristics of a healthy, multi-month uptrend, primarily trading within a well-defined ascending channel that began in late Q3.
The recent move saw price clear the immediate overhead resistance near $3,785, a pattern often described as an "Ascending Triangle" breakout on shorter timeframes, signalling a strong intention to continue the impulsive up-move sequence.
Critical Support and Resistance Levels for XAU/USD
In a market without historical price reference, technical analysis relies heavily on Fibonacci extension clusters and key psychological round numbers to define targets and supports.
| Level Type | Price ($/oz) | Significance for Gold Price Prediction 2025 |
|---|---|---|
| Immediate Support (S1) | $3,760 | This is the current dynamic support zone formed from recent consolidation. Holding this level is key for short-term bullish continuity. |
| Pivotal Support (S2) | $3,688 – $3,717 | The lower boundary of the Ascending Triangle formation. A "buy-the-dip" zone. Breach of this level risks a deeper correction. |
| Major Support (S3) | $3,620 | Aligns closely with the 20-day Moving Average (MA). Failure here would challenge the current uptrend. |
| Intermediate Resistance (R1) | $3,820 – $3,840 | The next Fibonacci extension cluster. Clearing this paves the way for the major psychological test. |
| Major Psychological Target (R2) | $3,900 | A critical, near-term psychological target. Expect profit-taking and potential short-term volatility here. |
| Ultimate Q4 Target (R3) | $4,000 | The next monumental psychological milestone and a key high-end XAU/USD Forecast for the end of 2025. |
The most important takeaway is that while the $3,800 breakout is confirmed, the market may require a small corrective pause to re-test key levels like $3,717 to onboard new buyers before the final assault on $4,000.
Momentum Indicators Deep Dive: RSI and MACD Analysis
Momentum oscillators provide vital information on the health and sustainability of the current rally. Our RSI MACD analysis confirms the underlying bullish conviction but suggests caution for short-term swing traders.
Relative Strength Index (RSI)
On the daily chart, the RSI remains comfortably in the bullish control zone, reading above the 50 level and recently entering the upper range (70+).
- Bullish Reading: Despite being elevated, the RSI has not flashed a strong bearish divergence (where price makes a new high but the RSI makes a lower high). This indicates that the current buying pressure remains authentic and aggressive.
- Implication: Traders should be aware of short-term risk, as extreme overbought readings often lead to temporary consolidation or mild pullbacks. However, in strong secular bull markets, the RSI can remain elevated for extended periods, making a sudden pullback a prime buy-the-dip opportunity rather than a reversal signal.
Moving Average Convergence/Divergence (MACD)
The MACD indicator, which tracks the relationship between two moving averages, confirms the long-term trend strength.
- Long-Term Signal: The MACD line remains well above its Signal line, and both are positioned firmly in positive territory (above the zero line). This configuration is the textbook definition of a powerful uptrend.
- Short-Term Caution: On hourly charts, the MACD histogram has recently started flattening or moving slightly back toward the zero line. This minor contraction signals that the speed of the short-term rally is normalizing after the explosive $3,800 breakout. This is a healthy sign of consolidation, not weakness, allowing the market to build a stable base for the next push.
The Dubai Advantage: Translation to Physical Assets
For investors based in the Dubai Gold Market, the technical strength of the XAU/USD price is a direct indicator of the long-term value of physical holdings. The high-volume trading seen on the Dubai Gold & Commodities Exchange (DGCX), combined with sustained local demand for physical 22K and 24K gold bars and coins, underscores that the UAE serves as a critical nexus for global gold accumulation.
The technical framework encourages a strategic approach: use any short-term pullback toward the $3,700–$3,717 support range as a calculated entry point to increase core positions, securing wealth preservation in the face of ongoing global fiscal and political instability. Gold is proving yet again that it is the ultimate global currency.
Conclusion and Strategic Outlook
The technical structure of the Gold Price Prediction 2025 path is exceptionally clear: firmly bullish. The successful breakout and consolidation above $3,800, supported by robust momentum indicators and historic fundamental tailwinds, clears the trajectory toward the $3,900 and $4,000 psychological targets in Q4.
Gold Trade, Dubai, advises clients to maintain their long positions, use the key technical Support and Resistance Levels defined above to manage risk, and view any corrective pullbacks toward the $3,700-$3,717 zone as optimal entry points. The golden bull is running, and the charts confirm that the direction is definitively higher. We are ready to help you capitalize on this historic moment.
Disclaimer: This report is for informational purposes only and does not constitute financial advice. Investors should conduct their own research or consult with a qualified financial advisor before making any investment decisions.
« Back to News & Reports List