October 31, 2025
Strategic Crossroads: Gold's Technical Pivot on October 31, 2025 – A Gold Trade Dubai Exclusive Report
Introduction: The End-of-Month Consolidation
As the global markets close out a remarkably volatile October, Gold (XAU/USD) finds itself at a pivotal technical juncture. The yellow metal, after touching its all-time high near $4,380 earlier this month, has undergone a sharp, albeit necessary, correction. This deep pullback has brought the price back to a critical psychological and technical threshold: the $4,000 per ounce level.
For our esteemed clients and investors at Gold Trade, Dubai, the strategic question is no longer about the rally’s existence, but about the integrity of its foundation. Is the recent dip a short-term correction that offers a prime buy gold Dubai opportunity, or is it a sign of a deeper structural shift? Our comprehensive Gold Technical Analysis Report for October 31, 2025, dissects the charts, indicators, and market sentiment to provide actionable insights for navigating the month ahead.
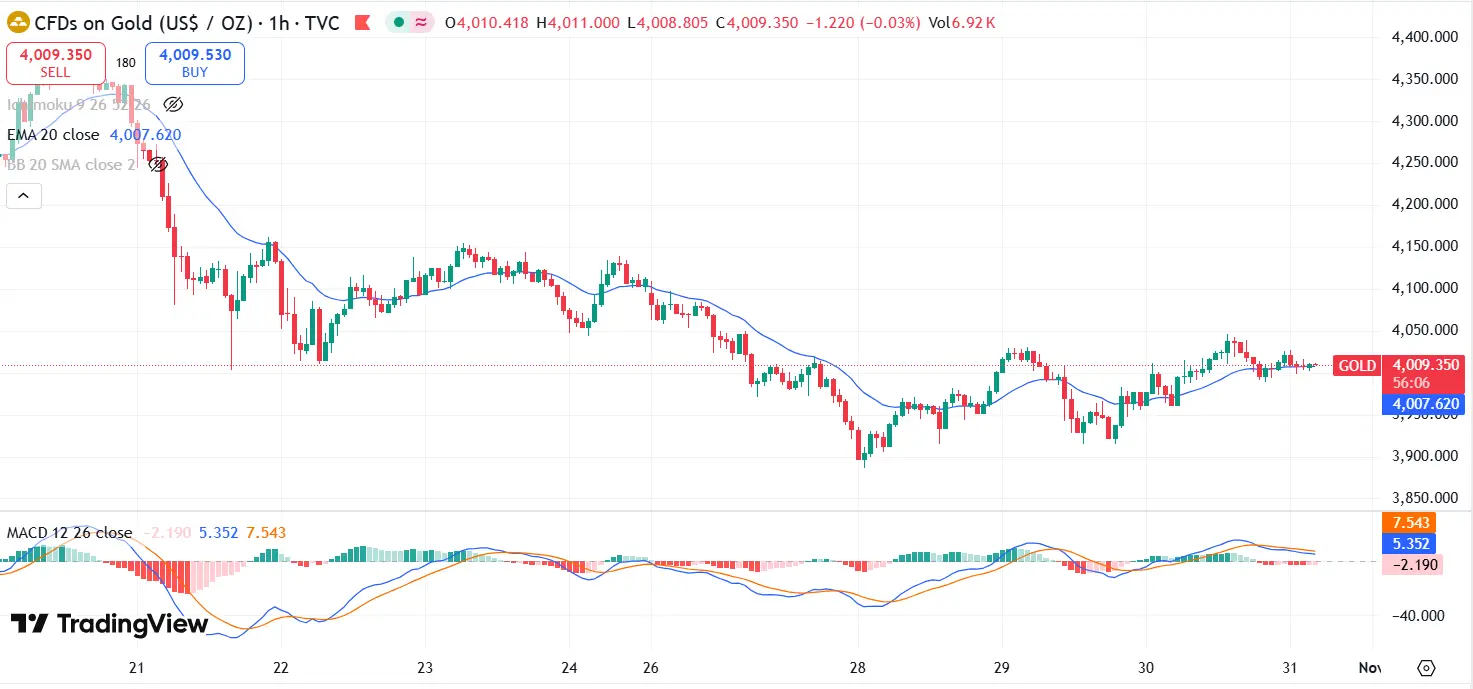
Technical Snapshot: XAU/USD on October 31, 2025
| Indicator | Daily Reading Action Bias | Implication |
|---|---|---|
| Price | ~$4,020.50 (EOD) Neutral/Mildly Bullish | Trading just above the key psychological pivot. |
| 50-Day Moving Average | ~$4,007.32 (Simple) | Support Test - A crucial line for confirming the broader uptrend. |
| RSI (14) | ~46.575 (Daily) Neutral | Momentum has cooled significantly from overbought; room for rebound. |
| MACD (12, 26) | Near Zero / Flat Consolidating | Loss of strong momentum, but no clear bearish crossover. |
| Fibonacci Retracement | 23.6% level near $4,000 | Key Support Holding this level is paramount for a quick recovery. |
(Source: Gold Trade Technical Desk, Data as of 11:45 AM GST, Oct 31, 2025)
Chart Deep Dive: The $4,000 Psychological and Technical Barrier
The recent price action for XAU/USD has been defined by a descent from its stratospheric peak. The key takeaway from the daily chart is the tenacious defence of the $3,980–$4,000 zone. This area is significant for three primary reasons:
- Psychological Benchmark: The symbolic $4,000 Gold Support acts as a powerful magnet for both professional and retail traders. Holding above it signals market confidence.
- Moving Average Convergence: The 50-Day Simple Moving Average (SMA) is currently converging around this mark, reinforcing it as a dynamic support level. A decisive daily close below the $3,980 mark, specifically challenging the 50-Day SMA, would significantly increase the risk of a deeper correction toward the next major support cluster at $3,847–$3,859 (50% Fibonacci Retracement of the recent multi-month advance).
- Fibonacci Retracement: The 23.6% Fibonacci retracement of the latest significant rally also hovers near the $4,000 level. Maintaining price above this line is essential for the bulls to argue the correction is complete and the rally is set to resume.
Crucial Resistance Levels are clearly defined above the current trading range. A breakout above the immediate resistance at $4,076 (which converges with an August trendline) would signal a recovery. The ultimate test for uptrend resumption remains the $4,125 level—the reversal high from the start of the steep correction. Only a sustained move and close above this level would convincingly invalidate the bearish technical setup established in the final weeks of October.
Fundamental Forces: The Evolving Narrative for Gold
While technical indicators provide the roadmap for short-term trading, the underlying Gold Price Prediction for 2026 remains tied to a powerful, evolving fundamental narrative.
1. The Strategic Asset Shift (The Unique Driver)
This is the most critical and unique element of the current precious metals market. Gold is no longer just a hedge against inflation or a play on interest rates; it has ascended to the status of a Strategic Gold Asset for global central banks. The unprecedented accumulation of gold by official institutions—particularly among non-Western and BRICS+ nations—is creating a structurally higher price floor.
This demand is driven by geopolitical fragmentation, de-dollarization efforts, and the desire to hold an asset free from any single nation's credit or political risk. This persistent, strategic purchasing fundamentally changes the long-term supply/demand equation and suggests that even deep corrections are seen as buying opportunities by sovereign entities. This unique trend underpins our long-term bullish outlook.
2. Cautious Central Banks and Rate Expectations
The US Federal Reserve’s recent 25-basis-point rate cut, coupled with the cautionary tone from Chairman Powell on further easing due to domestic uncertainties, initially dampened gold's momentum. The market is now digesting the prospect of a more measured pace of cuts, which supports the US Dollar Index (DXY) and puts mild pressure on dollar-denominated assets like gold. However, the prevailing environment of elevated inflation and the implicit 'Fed put' on the economy suggests that the long-term path for real rates remains accommodative, which is intrinsically supportive of gold.
3. US-China Trade Truce Volatility
Optimism surrounding the recent limited US-China trade agreement has slightly reduced the immediate demand for safe-haven assets. This improved risk sentiment contributed to the recent selling pressure. However, these "truces" are often fragile, and any flare-up in geopolitical or trade tensions provides an immediate, potent catalyst for gold to snap back into its safe-haven role.
Gold Trade's Actionable Strategy: Outlook & Recommendations
For investors seeking high-value insights, our Gold Trade Dubai strategy focuses on leveraging the confluence of technical support and long-term strategic demand.
Short-Term Strategy (Next 1–2 Weeks): Neutral-Bullish BiasThe immediate trading bias is Neutral to Mildly Bullish, based on the successful defence of the $4,000 Gold Support.
- Buying Opportunity: We recommend a Buy on Dips approach, specifically looking for opportunities above $3,980. This area represents a high-probability reversal zone where long-term buyers are likely to enter the market.
- Key Levels for Longs (Buyers):
- Entry: $3,980 – $4,010
- Stop Loss (Invalidation): A sustained daily close below $3,950 (to protect against a test of the $3,850 range).
- Targets (T1/T2): $4,076, followed by the main recovery target at $4,125.
Long-Term Strategy (12+ Months): Strongly Bullish
The foundational shift of gold to a Strategic Gold Asset remains the dominant long-term driver. For investors looking beyond the immediate volatility, the current consolidation offers a strategic accumulation phase.
- Long-Term Target: We maintain our projected long-term XAU/USD Forecast for a move toward the $4,500 level and potentially higher in the next 12–18 months, driven by de-dollarization and sustained central bank purchasing.
- Recommendation: Accumulate gold holdings during any pullbacks below $4,000, viewing dips as exceptional value in the context of the new global financial order.
Conclusion
October 31, 2025, marks a period of consolidation for Gold, successfully testing and holding the psychological $4,000 level following a significant correction. The technical defence is supported by a fundamental narrative that sees gold’s role expanding far beyond conventional inflation hedging. The confluence of key technical supports and unprecedented strategic demand provides a compelling case for a renewed upward trajectory. Gold Trade, Dubai advises clients to treat the current levels as a high-value entry point for a market poised for its next major move.
Disclaimer: This Gold Technical Analysis Report is for informational purposes only and does not constitute financial advice. Trading XAU/USD and other Precious Metals Market assets involves significant risk. Consult with your financial advisor before making any investment decisions.
Would you like a personalized consultation with a Gold Trade Dubai expert to discuss your investment strategy based on this Gold Price Prediction?
« Back to News & Reports List