December 19, 2025
Gold Technical Analysis Report: Dec 19, 2025 – Navigating the Year-End Breakout
By Gold Trade, Dubai | Date: December 19, 2025
As we approach the final trading sessions of 2025, the global bullion market is witnessing a historic phase of "high-altitude" consolidation. For investors and traders at Gold Trade, the current price action in XAU/USD represents a critical juncture. After a year defined by central bank diversification and shifting Federal Reserve policies, gold is coiling within a symmetrical triangle, hinting at a massive volatility expansion before the 2026 curtains open.
In this comprehensive technical analysis report, we break down the key support and resistance levels, momentum indicators, and the fundamental catalysts driving the Dubai gold market today.
Executive Summary: The State of Gold in Late 2025
On this Friday, December 19, 2025, spot gold is trading near $4,328 per ounce, successfully holding above the psychological $4,300 threshold. The market has spent much of the week digesting gains after a softer-than-expected US Consumer Price Index (CPI) report fueled bets for continued interest rate cuts in early 2026.
Key Market Data at a Glance:
- Current Spot Price: $4,328.15
- Daily High/Low: $4,335.20 / $4,306.45
- 24K Gold Price (Dubai): AED 522.25 per gram
- Market Sentiment: Bullish-Neutral (Consolidation)
Fundamental Drivers: Why Gold Remains the "Cornerstone Asset"
To understand the technicals, one must look at the macro backdrop. 2025 has been a "Golden Era" for precious metals. Several factors have converged to keep Gold Trade clients active:
- The Federal Reserve’s "Dovish" Pivot: Markets are currently pricing in a high probability of a rate cut in the first quarter of 2026. Lower interest rates reduce the opportunity cost of holding non-yielding assets like gold, providing a natural floor for prices.
- Central Bank Demand: According to the World Gold Council, central banks have added over 800 tonnes to their reserves year-to-date. This institutional "buy-the-dip" mentality has prevented any significant deep corrections.
- Geopolitical Risk Premium: Persistent tensions in global trade and regional conflicts continue to sustain gold's status as the ultimate safe haven.
- Inflation Dynamics: While US inflation is cooling, the "sticky" nature of service-sector costs ensures that gold remains a preferred hedge against currency debasement.
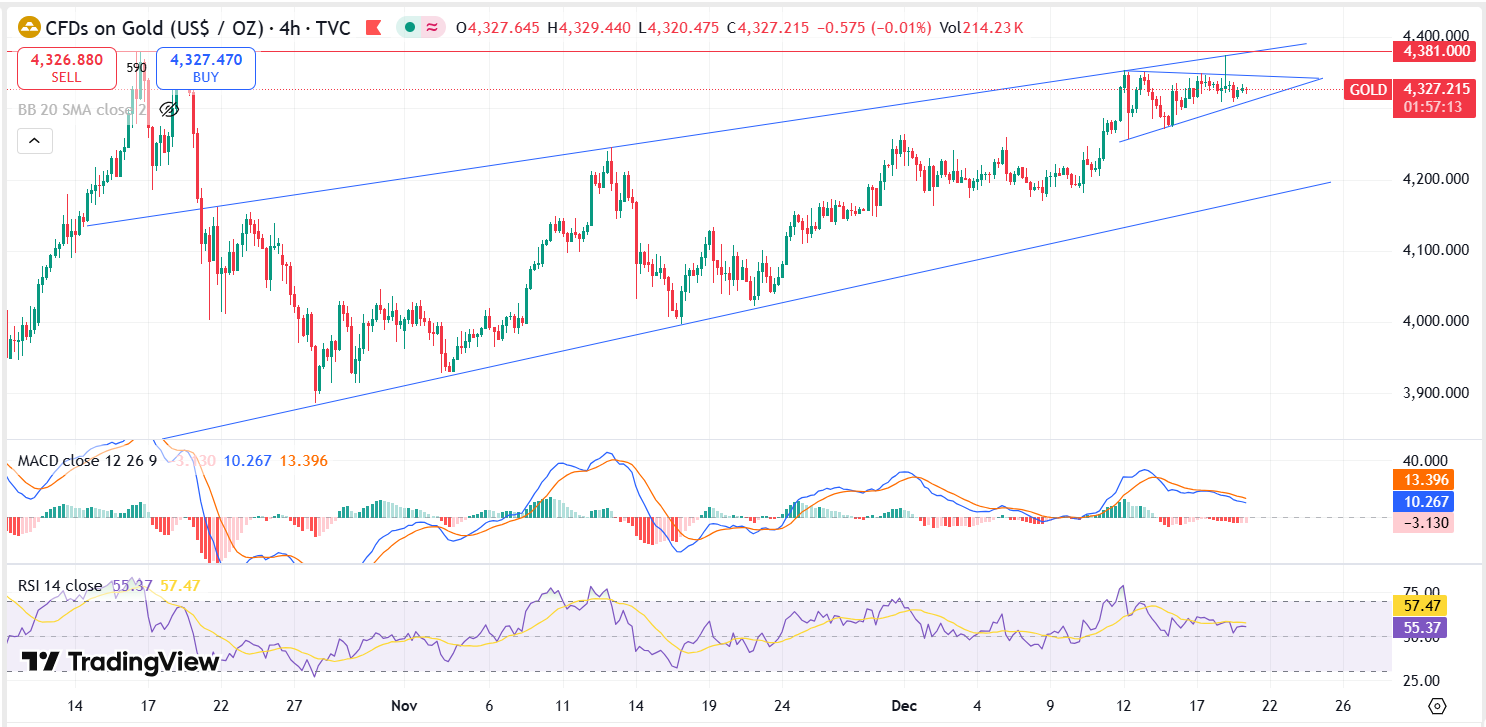
Technical Analysis: Breaking Down the XAU/USD Chart
The technical setup for December 19, 2025, suggests that the bulls are in control, but a "catalyst-starved" market is causing short-term indecision.
1. The Symmetrical Triangle Pattern
On the 4-hour and Daily charts, gold has formed a clear Symmetrical Triangle. This pattern typically precedes a breakout in the direction of the prevailing trend—which, in 2025, is decidedly upward. The price is coiling between the descending resistance line from October’s all-time high of $4,382 and the ascending support line from the December 1st lows.
2. Moving Averages (EMA 50 & EMA 200)
- 50-Day EMA ($4,307): This is the immediate "line in the sand." As long as daily candles close above $4,307, the short-term structure remains constructive.
- 200-Day EMA ($4,120): This long-term indicator confirms the broader bull market. We are currently trading significantly above the 200-EMA, which indicates strong underlying momentum.
3. Relative Strength Index (RSI)
The RSI is currently hovering at 57.7, moving up from a neutral 50. This suggests that the market is neither overbought nor oversold. There is ample "fuel in the tank" for a run toward the $4,400 level if the current resistance is breached.
4. Fibonacci Retracement Levels
Using the swing low of early November to the October peak:
- 23.6% Level ($4,310): Current immediate support.
- 38.2% Level ($4,265): The "value zone" where buyers have historically stepped in this month.
Key Support and Resistance Levels for Traders
For our clients at Gold Trade, these are the critical "battle lines" for the upcoming sessions:
| Level Type | Price (USD) | Significance |
|---|---|---|
| Major Resistance 2 | $4,445 | Target for the triangle breakout; 1.618 Fib extension. |
| Major Resistance 1 | $4,356 | Recent "High Day Close" (HDC). A break here confirms the rally. |
| Pivot Point | $4,320 | The mid-range equilibrium for today's trade. |
| Immediate Support | $4,300 | Key psychological floor and 50-day EMA confluence. |
| Major Support 1 | $4,265 | Structural support; failure here could lead to $4,180. |
Dubai Gold Market Update: 19 Dec 2025
Dubai, the "City of Gold," continues to offer the most competitive spreads for physical and digital trading. Today's retail rates in Dubai show a slight uptick in line with global spot movements.
- 24K Gold: AED 522.25 per gram
- 22K Gold: AED 483.50 per gram
- 21K Gold: AED 463.75 per gram
- 18K Gold: AED 397.50 per gram
At Gold Trade, we have observed a surge in "buy-on-limit" orders near the AED 515–518 range for 24K gold, as local investors look to lock in positions before the expected year-end volatility.
Strategy: How to Trade the Current Setup
Based on the technical data, our analysts at Gold Trade recommend the following strategic approaches:
- The Breakout Play: Enter a long position on a decisive 4-hour candle close above $4,356. Target the $4,420–$4,445 zone with a stop-loss placed just below the $4,320 pivot.
- The Pullback Play: For conservative investors, look for a retest of the $4,280–$4,300 support zone. This area offers a high-probability entry point with a favorable risk-reward ratio, targeting a return to $4,350.
- Risk Management Note: Given that we are in the "thin" liquidity period of late December, traders should be wary of "stop-hunts" and sudden spikes. Ensure that stop-losses are placed with enough "breathing room" to account for year-end spread widening.
2026 Outlook: Is $5,000 on the Horizon?
As we peer into the next year, the consensus among top-tier financial institutions like J.P. Morgan and Morgan Stanley is overwhelmingly bullish. With gold's share of central bank reserves surpassing US Treasuries for the first time in decades, the structural demand for the metal is higher than ever.
Forecasts suggest that if the $4,445 resistance is cleared in early January, the path toward $4,700 and eventually the $5,000 milestone becomes the primary narrative for 2026.
Conclusion
The Gold Technical Analysis Report for 19 Dec 2025 highlights a market that is coiling for its next big move. While the "wait-and-see" approach dominates the current session, the technical bias remains firmly to the upside. Whether you are trading XAU/USD on the Comex or buying physical bars at Gold Trade, the trend is your friend.
Stay disciplined, monitor the $4,356 resistance closely, and ensure your portfolio is prepared for the 2026 "Golden Breakout."
Disclaimer: This report is for informational purposes only and does not constitute financial advice. Gold trading involves significant risk. Investors should conduct their own research or consult with a professional advisor at Gold Trade, Dubai, before making any investment decisions.
« Back to News & Reports List