December 20, 2025
Weekly Gold Technical Analysis Report: 22-26 Dec 2025
As the global financial markets transition into the final full week of 2025, gold (XAU/USD) remains the focal point for investors in Dubai and beyond. Operating from the heart of the "City of Gold," Gold Trade provides this comprehensive technical analysis to guide traders through a week characterized by holiday-thinned liquidity and high-stakes technical pivots.
Following a historic year where gold shattered previous records to trade above the $4,300 mark, the period of December 22-26, 2025, presents a unique landscape. This report delves into the price action, momentum indicators, and the fundamental backdrop shaping the bullion market during the festive season.
Market Sentiment: The "Santa Rally" vs. Holiday Consolidation
The prevailing sentiment for gold as we head into Christmas week is one of cautious optimism. While the metal has surged nearly 65% in 2025—its strongest annual performance since the late 1970s—the current price action suggests a period of consolidation.
Investors are balancing a softening US inflationary environment (with CPI hovering around 2.7%) against a resilient US Dollar. However, the anticipation of further Federal Reserve rate cuts in early 2026 continues to provide a sturdy floor for prices, preventing any significant year-end sell-off.
Technical Analysis: Breaking Down the XAU/USD Chart
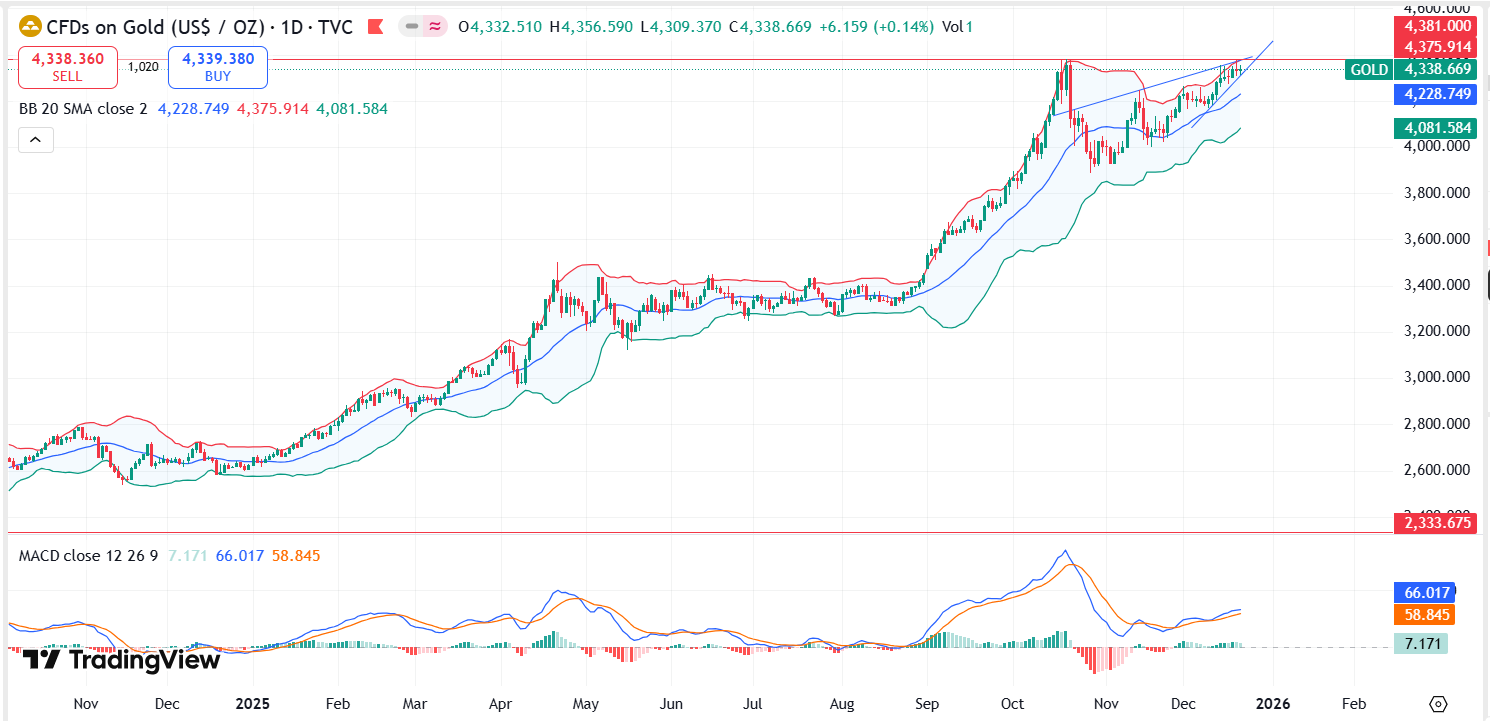
As of the market open on December 22, 2025, spot gold is trading near $4,330 per ounce. The technical landscape reveals a market "treading water" within a well-defined ascending triangle on the 4-hour and daily timeframes.
1. Moving Averages and Trend Strength
Gold remains comfortably positioned above its 50-day Exponential Moving Average (EMA) , currently situated near $4,150. This level has served as a dynamic support throughout the Q4 rally. The fact that the spot price is trading significantly higher than the 200-day Simple Moving Average (SMA) confirms that the long-term primary bullish trend remains firmly intact.
2. Relative Strength Index (RSI)
The 14-day RSI is currently printing at 54.64. This is a "neutral-plus" reading, indicating that while the bulls have the upper hand, the market is neither overbought nor oversold. This leaves ample room for a potential breakout if a catalyst emerges during the holiday sessions.
3. MACD and Volatility Squeeze
The Moving Average Convergence Divergence (MACD) indicator shows a narrowing of the histogram bars near the zero line. This "convergence" suggests a temporary loss of momentum. Coupled with contracting Bollinger Bands, we are witnessing a classic volatility squeeze. Typically, such periods of low volatility are the precursors to explosive moves once liquidity returns to the market.
Key Technical Levels to Watch (Dec 22-26)
Traders should monitor the following price levels closely. A decisive breach of these zones on a daily closing basis will likely dictate the direction for the remainder of 2025.
Resistance Levels (Upside Targets)
- Immediate Resistance ($4,355): This is the upper boundary of the current ascending triangle. A break here is the first signal of a bullish resumption.
- Major Resistance ($4,378 - $4,381): The all-time high (ATH) established in November 2025. Clearing this level opens the psychological path toward $4,400.
- Long-term Target ($4,600): If momentum sustains, Elliott Wave projections suggest $4,600 as the next major extension in early 2026.
Support Levels (Downside Protection)
- Psychological Support ($4,300): A round number that has held firm over the last several trading sessions.
- Critical Pivot ($4,260): This is the "line in the sand" for bulls. A daily close below $4,260 would invalidate the immediate bullish setup and signal a deeper correction.
- Structural Support ($4,150): Confluent with the 50-day EMA; this represents a high-value entry zone for long-term investors.
| Level Type | Price (USD) | Significance |
|---|---|---|
| Resistance 2 | $4,381 | All-Time High / Major Barrier |
| Resistance 1 | $4,355 | Triangle Breakout Point |
| Current Spot | $4,330 | Market Pivot |
| Support 1 | $4,300 | Psychological Floor |
| Support 2 | $4,260 | Critical Trend Invalidation |
The "Dubai Factor": Local Demand and Festive Trading
In Dubai, the retail and physical bullion markets often move in tandem with global spot prices, but with localized premiums driven by the festive season.
During the final week of December, the Dubai Gold Souk and major refineries like those partnered with Gold Trade see an uptick in physical demand for jewelry and 24K bars. This local "festive floor" often provides a cushion for prices during periods of global institutional inactivity.
The current live retail gold rate in Dubai for 24K is approximately 522.75 AED per gram, reflecting the strong global valuation of the metal. Investors looking to hedge their portfolios before the new year often utilize this period to finalize physical acquisitions.
Holiday Trading Schedule & Liquidity Warning
Traders must be aware of the altered market hours for the week of December 22-26, 2025:
- Wednesday, Dec 24 (Christmas Eve): Markets will close early (typically around 20:45 GMT for metals). Expect spreads to widen as liquidity thins in the afternoon.
- Thursday, Dec 25 (Christmas Day): All major global markets are closed. No trading will occur.
- Friday, Dec 26 (Boxing Day): While US markets technically reopen, many European and Commonwealth hubs remain closed. Trading volumes are expected to be extremely low.
Risk Advisory: Low-liquidity environments can lead to "flash" movements or erratic price gaps. It is highly recommended to use guaranteed stop-losses and avoid over-leveraging during the holiday break.
Fundamental Catalysts: What’s Moving the Needle?
Beyond the technicals, three fundamental pillars are supporting gold’s high valuation:
- Geopolitical Risk: Persistent tensions in Eastern Europe and South America (specifically regarding Venezuelan oil sanctions) have maintained a consistent safe-haven bid for gold.
- Central Bank Accumulation: Central banks, led by emerging markets, continue to diversify away from the US Dollar. The World Gold Council’s Q3 2025 report (released late October) record-breaking quarterly demand of over 1,300 tonnes in late 2025 due by massive investment (ETFs, bars/coins) and strong central bank buying amidst geopolitical uncertainty.
- Inflationary Hedging: Despite a cooling headline CPI, core inflation remains sticky at 2.6%, driving investors toward "hard assets" that retain purchasing power.
Summary and Forecast
For the week of December 22-26, 2025, our outlook for gold is Neutral to Mildly Bullish. We anticipate the price will remain trapped between the $4,300 support and $4,355 resistance for the majority of the week.
A breakout above $4,355 would confirm a "Santa Rally" toward the $4,380 record high. Conversely, a failure to hold $4,260 would signal that the market requires a deeper retracement to gather strength for the 2026 leg of the bull run.
At Gold Trade, we remain committed to providing the most accurate market insights and premium bullion services in the UAE. Whether you are a day trader navigating the XAU/USD charts or a long-term investor securing physical assets, our team is here to support your journey in the world’s most enduring asset class.
Disclaimer: This report is for informational purposes only and does not constitute financial advice. Gold trading involves significant risk. Investors should conduct their own research or consult with a professional advisor at Gold Trade, Dubai, before making any investment decisions.
« Back to News & Reports List