November 24, 2025
Daily Market Open – Critical Intraday Analysis
Gold Technical Analysis Report (24 Nov 2025): XAU/USD Stabilizes at $4,066, Preparing for Key US Data
Actionable Gold Price Forecast and Intraday Strategy from the Analysts at Gold Trade, Dubai.
Executive Summary: Consolidating Near Critical Support
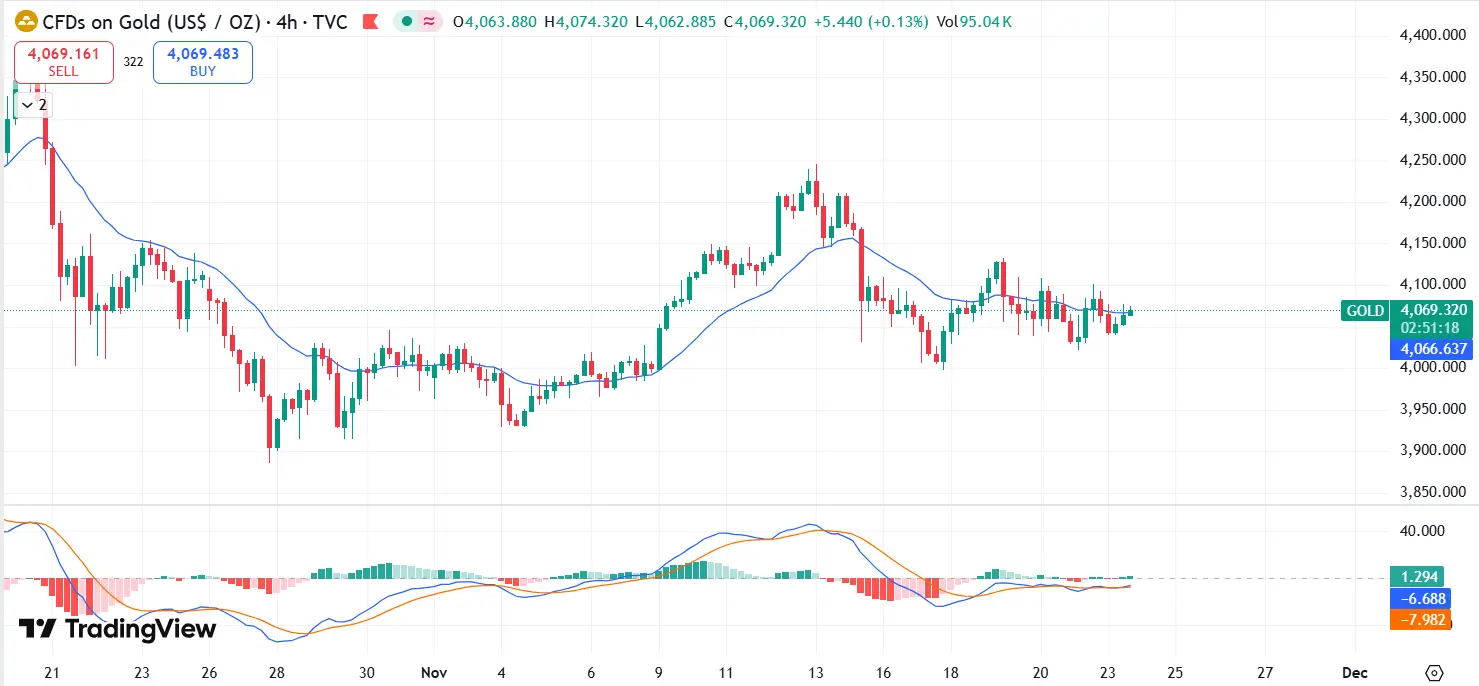
As the Asian session closes and the European market opens on 24 November 2025, the XAU/USD price is consolidating narrowly around the $4,066 per ounce pivot. This stability follows last week's brutal corrective wave that successfully defended the structural support zone between $4,050 and the psychological $4,000 support. The market is exhibiting classic 'wait-and-see' behavior, driven by thin liquidity and anticipation ahead of key US economic releases later in the week.
Our Daily Gold Technical Analysis Report emphasizes that this current price point of $4,066 places Gold directly on the precipice of its most critical short-term defense. Intraday traders must focus entirely on the $4,050 level (S1) below and $4,085 (R1) above. A breakout in either direction will likely dictate the entire movement for the early part of the week. For clients of Gold Trade, Dubai, understanding these immediate boundaries is crucial for protecting capital and executing timely trades in the highly leveraged Dubai Gold Market.
Section I: Intraday Price Dynamics – The Defense of the $4,050 Floor
Over the weekend and into the early hours of Monday, the Gold price has been remarkably quiet, suggesting that institutional players are content to let the market digest the recent losses. The low volatility is typical after such a sharp move, as the market looks for a new fundamental driver or a clear technical signal to initiate the next trend. The fact that the price has not attempted a strong re-test of $4,050 is a tentative positive for the bulls.
However, the structure of the recent move dictates that the bears maintain an intermediate advantage. The overhead supply, particularly around the $4,150 former support, remains immense. Until this level is convincingly reclaimed, any upward move should be treated as a temporary short-covering rally. The intraday movement on the 4-hour chart suggests a tight range is forming—a classic pennant pattern—indicating that explosive movement is likely once the market breaks the range. This consolidation period is essential for building a robust Gold Price Forecast.
Section II: Mapping Key Support and Resistance Zones
The following table outlines the critical levels derived from Fibonacci retracements, prior swing highs, and psychological barriers, crucial for navigating the market from Gold Trade, Dubai:
| Level Type | Price ($/oz) | Intraday Significance & Trading Action |
|---|---|---|
| Primary Intraday Resistance (R1) | $4,085 | The high of the current consolidation range. A break confirms short-term bullish control towards R2. |
| Major Resistance (R2) | $4,115 | Previous minor swing low. Necessary to clear this to erase the recent bearish pressure. |
| Current Price Zone | $4,066 | The current pivot. Positioning here is neither bullish nor bearish; it's a holding pattern. |
| Primary Intraday Support (S1) | $4,050 | The absolute most critical line for the day. A clean break triggers immediate selling pressure toward S2. |
| Ultimate Support (S2) | $4,000 | Major psychological barrier. A break here confirms a deeper structural correction. |
Section III: Indicator Momentum – The RSI Bounce and Bollinger Band Squeeze
Relative Strength Index (RSI): The Daily RSI remains below the 50 neutral line, confirming the intermediate-term bearish control. Crucially, however, the 4-hour RSI has successfully bounced from the oversold (below 30) level and is currently hovering near 40. This bounce provides the first sign of technical breathing room for the bulls. If the 4-hour RSI can push above 50, it would align with a price move above $4,085 and signal a sustained recovery attempt.
Bollinger Bands: On the 4-hour chart, the Bollinger Bands are exhibiting a noticeable squeeze. This squeeze, where the upper and lower bands contract significantly, often precedes an aggressive breakout in volatility. Given the market's position just above major support, the breakout is likely to be violent. Traders must prepare for an expansion of price movement once this consolidation resolves itself.
MACD: The Moving Average Convergence Divergence (MACD) indicator on both daily and 4-hour charts remains firmly below the zero line, confirming that bearish momentum is the prevailing force. While the lines are flattening (suggesting the momentum is decelerating), no bullish cross-over signal is imminent. This reinforces the need for caution; the technical rally must first prove itself against the dominant MACD bearish signal.
Section IV: Strategic Outlook and The Gold Trade, Dubai Advantage
Daily Trading Scenarios (24 Nov 2025):
- The Bullish Play: A breakout and 4-hour close above $4,085 (R1). Initiate tactical long positions targeting $4,115 (R2), with a stop-loss just below $4,060.
- The Bearish Play: A decisive break and 4-hour close below $4,050 (S1). Initiate short positions targeting the $4,000 psychological barrier (S2), with a stop-loss above $4,075.
- Consolidation/Wait-and-See: If the price remains locked between $4,050 and $4,085, volatility is likely to remain low. Day traders should scalp the boundaries, while investors focused on wealth preservation should await confirmation before entering the market.
Long-Term Investment & 24K Physical Gold
While short-term trading remains technically challenging, the long-term outlook for Gold Investment remains highly supportive. The current pullback to the $4,066 level represents a strategic opportunity for long-term investors. We advise our clients in the Dubai Gold Market to utilize this technical dip to strategically accumulate 24K physical gold. The fundamentals—including elevated inflation, global sovereign debt, and currency devaluation risk—firmly argue that Gold is essential for portfolio diversification and wealth preservation.
Gold Trade, Dubai reiterates that strict adherence to defined stops and leverage management is non-negotiable on a high-volatility trading day like today. Use the $4,050 and $4,085 levels as your guide.
IMPORTANT FINANCIAL DISCLAIMER
This Gold Technical Analysis Report - 24 Nov 2025 is intended solely for informational purposes by Gold Trade, Dubai, and does not constitute personalized financial advice, investment recommendation, or an offer to buy or sell. Trading in precious metals like XAU/USD carries a high level of risk and is not suitable for all investors. Leverage can work both for and against you. All investors should consider their personal financial situation, risk tolerance, and consult with an independent financial advisor before engaging in any Gold Investment or trading activities in the Dubai Gold Market. Gold Trade, Dubai, and its affiliates are not responsible for any losses incurred as a result of using the information provided herein.
« Back to News & Reports List