December 04, 2025
Gold Technical Analysis Report - 04 Dec 2025: Navigating the $4,200 Crossroads
Published Exclusively for Clients of Gold Trade, Dubai, UAE
Introduction: The $4,200 Pivot and Macro Drivers
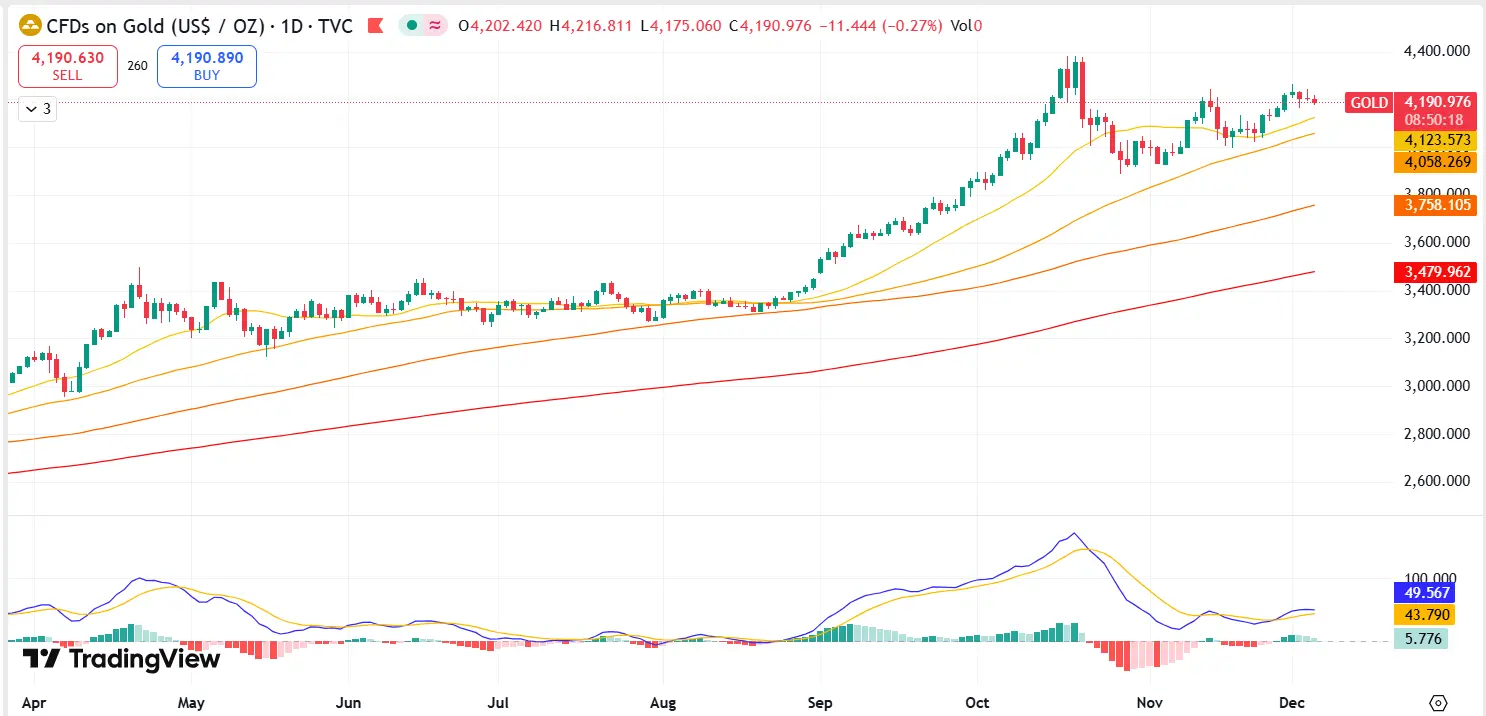
As the global financial calendar turns to the final month of 2025, the gold price (XAU/USD) stands at a pivotal juncture, trading firmly above the significant $4,000 per ounce psychological threshold. Specifically, the precious metal is consolidating near the $4,200 mark, a level that represents both historic strength and near-term uncertainty. For our distinguished investors at Gold Trade Dubai, understanding the technical landscape is critical for capitalizing on the next major move.
Our analysis finds the yellow metal in a high-stakes compression phase. The primary macro drivers for gold price 2025—namely persistent central bank buying, sustained geopolitical risk, and heightened expectations for a rate-cutting cycle by the US Federal Reserve—continue to provide a robust bullish gold bias. The recent weakness in the US Dollar Index (DXY) below the 99-barrier has further amplified gold’s appeal, making it relatively cheaper for international buyers and fueling the current consolidation. This report provides a detailed breakdown of the technical signals to forecast the directional shift.
Key Technical Levels: Support and Resistance Zones
The weekly and daily charts for XAU/USD reveal a market that has respected defined boundaries following its monumental rally earlier in 2025. We have identified crucial Gold Support and Resistance levels that will dictate the short- to medium-term trajectory of the price action.
Major Resistance Levels (The Breakout Targets)
The immediate challenge for bulls lies in overcoming the November high-day close and the subsequent cluster of resistance just above the $4,250 level. A decisive break above this zone is necessary to confirm the resumption of the broader uptrend toward record highs.
| Level (USD/oz) | Significance | Implication |
|---|---|---|
| $4,255 | Short-Term Resistance / Monthly High | A daily close above this level triggers momentum toward the next tier. |
| $4,381 | All-Time High (ATH) / Historical Peak | The definitive target for the current bullish leg, representing the maximum recorded price in 2025. |
| $4,509 | Fibonacci Extension (1.272) | The projected target if the $4,381 ATH is broken and confirmed as new support. |
Critical Support Levels (The Bearish Triggers)
While the fundamental bias remains positive, a failure to hold critical support zones would signal profit-taking and a deeper correction. The current trading price is hovering just above the immediate support at $4,202, which aligns with a key pivot point.
| Level (USD/oz) | Significance | Implication |
|---|---|---|
| $4,202 | Immediate Intraday Support / Pivot Point | A break below this level could quickly accelerate selling pressure. |
| $4,157 | Weekly Open Support / Confluence Zone | Holding this level is crucial to maintaining the near-term bullish structure. |
| $4,000–$4,024 | Critical Psychological Support / 61.8% Retracement | The most vital level. A breach here would invalidate the 2025 uptrend and suggest a substantial, structural correction. |
Deep Dive into Momentum Indicators
For traders specializing in short-term volatility, the momentum indicators offer nuanced signals that point toward a high probability of an imminent directional move.
Relative Strength Index (RSI) Analysis
The 14-day RSI is currently sitting in the neutral territory, noted around 48. This reading is particularly significant because it indicates neither overbought nor oversold conditions, suggesting that the asset has ample room to run in either direction without immediate exhaustion.
- Bullish Signal: A push above the 50 centerline towards the 70 overbought threshold would confirm the bullish continuation.
- Bearish Signal: A dip below 40 would confirm bearish momentum and increase the likelihood of testing the $4,100 support zone.
Moving Average Convergence Divergence (MACD)
The MACD histogram has been oscillating near the zero line, confirming the recent consolidation. The MACD line is currently moving sideways in the negative zone, but close to the signal line, suggesting potential for an upward crossover.
- Key Indicator: A bullish crossover (MACD line moving above the signal line) accompanied by a histogram rise above the zero line would provide robust confirmation of a strong upward impulse.
Moving Averages (MA)
On the daily chart, the alignment of the 50-day Exponential Moving Average (EMA) and the 200-day Simple Moving Average (SMA) is highly instructive. The 50-day EMA continues to hover well above the 200-day SMA, maintaining the Golden Cross structure established earlier in the year.
- 50-Day EMA: Currently providing dynamic support well below the current price, reinforcing the long-term bullish posture.
- 200-Day SMA: Represents the long-term trend boundary. As long as the Gold Price Forecast remains above the 200-day SMA, the overall trend is considered structurally bullish, irrespective of short-term pullbacks.
The Gold Trade Forecast Scenarios
Based on the confluence of macro fundamentals and technical indicators, we project two primary scenarios for Gold Trade’s clients in the coming weeks of December 2025.
Scenario A: Bullish Breakout (Primary Focus)
The increasing probability of a Federal Reserve rate cut in mid-December, combined with strong central bank demand, makes the bullish scenario the most favored outlook.
- Trigger: A decisive, high-volume daily close above $4,255.
- Target 1 (TP1): $4,313 (Next intermediate resistance).
- Target 2 (TP2): $4,381 (Re-testing the All-Time High).
- Extended Target (TP3): If $4,381 is breached, the path opens to the Fibonacci extension target near $4,509, establishing a new historic record.
Scenario B: Corrective Pullback (Risk Management Zone)
A risk-off sentiment driven by unexpected positive US jobs data or a more hawkish tone from the Fed could trigger profit-taking, especially after the substantial November rally.
- Trigger: A sustained, high-volume daily close below the $4,202 immediate support.
- Support 1 (S1): $4,157 (Testing the weekly open).
- Support 2 (S2): $4,000–$4,024 (The key psychological buffer). This area should be considered a prime buy-on-dips opportunity, assuming the long-term bullish thesis remains intact.
- Invalidation: A close below $3,930 would significantly jeopardize the 2025 uptrend, signaling a deeper correction toward $3,846.
Actionable Strategy Summary for Dubai Investors
As trusted partners in the region's precious metals market, Gold Trade recommends a disciplined, tiered strategy:
- Wait for Confirmation: Avoid entering large positions in the current $4,202–$4,255 compression range. Wait for a confirmed, decisive daily close outside of this range.
- Tiered Accumulation: Use the Critical Support zone between $4,000 and $4,024 as a tiered accumulation area. This represents a strong technical and psychological floor for investors looking for long-term exposure.
- Risk Management: All long positions initiated on a bullish gold breakout above $4,255 should utilize a tight stop-loss order placed below the $4,157 level to protect capital against sudden market reversals.
The consensus remains that the bullion complex is structurally positioned for higher prices into 2026, driven by monetary policy shifts and enduring safe-haven demand. The current market phase is a necessary consolidation, setting the stage for the next significant move in the XAU/USD pair.
Disclaimer: This Gold Technical Analysis Report is for informational purposes only and does not constitute financial advice. Investors should consult with a qualified financial professional before making investment decisions and conduct their own risk assessment.
« Back to News & Reports List