December 05, 2025
Gold's Golden Ascent: Technical Analysis Report for December 5, 2025 – A Gold Trade, Dubai Exclusive
Executive Summary: Bullish Momentum Intact, Targeting $4,300
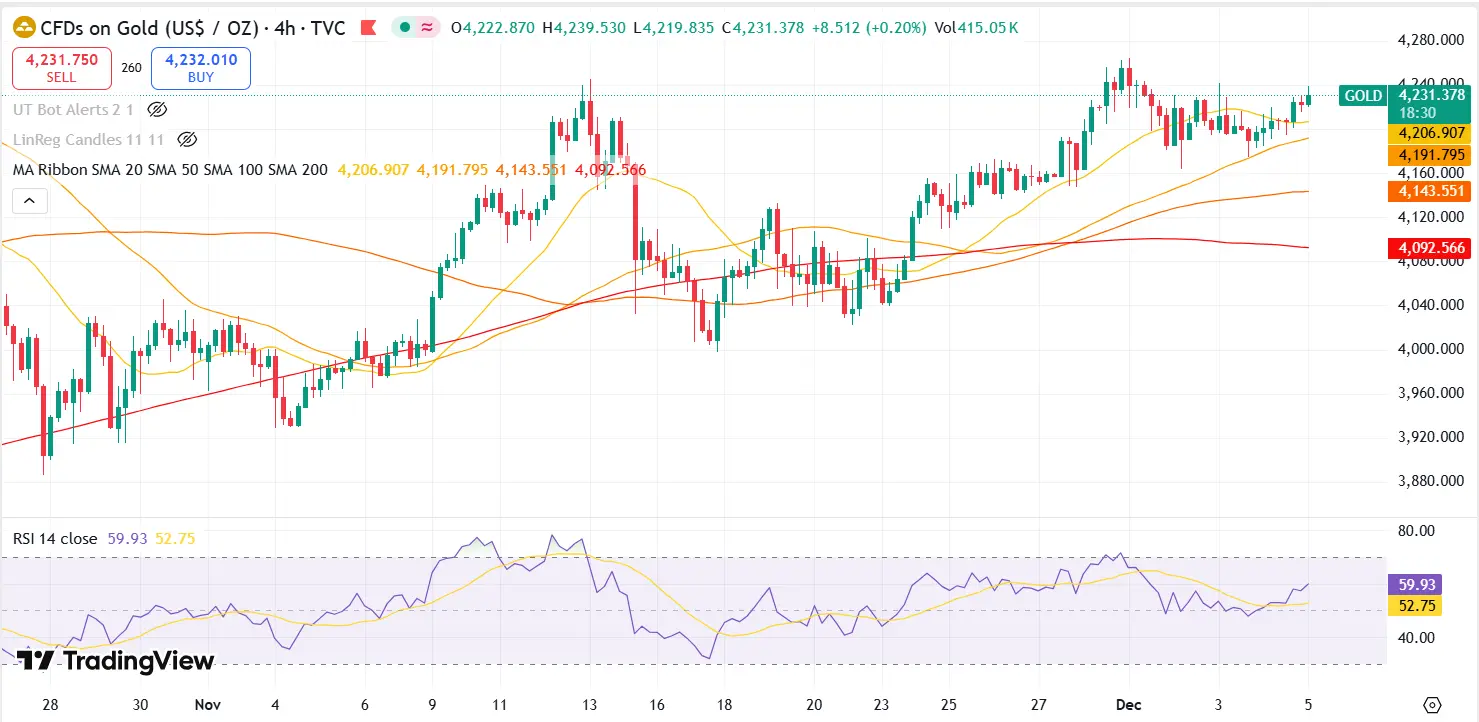
As the global market year draws to a close, the price of spot gold (XAU/USD) on December 5, 2025, maintains a powerful bullish trajectory, firmly supported by both technical indicators and a shifting fundamental landscape. Trading near the $4,220–$4,230 psychological level, the yellow metal has absorbed recent profit-taking activities and is poised to challenge new, higher resistance zones. The primary technical outlook for Gold Trade, Dubai clients suggests a continuation of the rally, with an immediate target at $4,264 and a high-conviction move toward the significant $4,300 psychological and technical ceiling.
The core narrative underpinning this strength is the pervasive expectation of a monetary policy pivot by the US Federal Reserve. With markets pricing in a high probability (85-90%) of a December rate cut, the US Dollar (USD) remains under pressure, which is historically a significant tailwind for dollar-denominated assets like gold. This technical report provides an in-depth, unique analysis for our esteemed clients navigating the dynamic Dubai Gold Market.
The Macro-Technical Confluence: Fundamentals Driving the Charts
The current technical setup cannot be isolated from the prevailing macroeconomic environment. For months, the gold market has been characterized by "buying the dip" behavior, a sign of structural bullishness.
- Federal Reserve Dovish Tilt: Weak US economic data, particularly concerning the labor market and inflation gauges like the Personal Consumption Expenditures (PCE) Price Index (due for release today), has intensified expectations for aggressive rate cuts. Lower interest rates decrease the opportunity cost of holding non-yielding assets like gold, driving capital inflows.
- Geopolitical Safe-Haven Demand: Persistent global tensions, including ongoing geopolitical conflicts, ensure a steady baseline of safe-haven demand for gold. This demand acts as an impenetrable floor, preventing severe downside corrections.
- Institutional and Central Bank Buying: Strong reports of continued central bank accumulation and robust inflows into gold-backed ETFs further solidify gold’s position as a strategic asset, moving it from a defensive hedge to a core component of global reserves. This creates a technical “demand cushion” that lifts the metal's valuation.
Detailed Technical Analysis (XAU/USD - Daily and H4 Charts)
- Trend Structure and Channels
On the daily chart, gold is in a clear, multi-month ascending channel that began following the breach of the $4,000 level. The price action currently sits comfortably in the upper half of this channel, validating the strength of the uptrend.
- Ascending Channel: The price action confirms a pattern of higher highs and higher lows, the quintessential definition of an uptrend. Recent sideways consolidation (around $4,205–$4,245) should be viewed as a healthy pause for profit-taking and accumulation before the next leg higher, rather than a reversal signal.
- Symmetrical Triangle Pattern (H4): On the 4-hour chart, price action near the $4,205 central axis suggests a potential symmetrical triangle formation. A decisive breakout above the upper boundary of this pattern (near $4,245) would confirm the return of bullish momentum and signal a swift move to the next major resistance.
- Key Support and Resistance Levels
Identifying critical price levels is paramount for any successful Gold Technical Analysis. These zones define potential entry, exit, and stop-loss placements for Gold Trade, Dubai clientele.
Level Type Price (XAU/USD) Significance Action Bias Immediate Resistance (R1) $4,245 - $4,264 The November high and immediate ceiling for breakout confirmation. Breakout Target Major Resistance (R2) $4,300 - $4,321 Significant psychological and technical target; upper Bollinger Band/channel resistance. Ultimate Resistance (R3) $4,380 - $4,400 A strong continuation target, opening the path to $4,500 forecasts. Extended Target Immediate Support (S1) $4,208 Reinforced by the 20-day Exponential Moving Average (EMA). Key Entry Point/Stop Major Support (S2) $4,180 Previous swing low and ascending trendline support. Crucial Break-Down Level Structural Support (S3) $4,151 The 0.786 Fibonacci retracement level of the latest bullish wave. Trend Invalidation Risk Gold Trade Insight: The key battle for the day lies at the $4,245 level. A sustained close above this point, particularly post-PCE data, would unleash a rapid ascent towards the $4,300 zone, making this an excellent Buy Gold Dubai entry signal.
- Momentum and Volatility Indicators
The indicators reinforce the underlying bullish sentiment, despite signs of short-term overextension.
- Moving Averages (MA): All key moving averages (5-day, 10-day, 20-day, 50-day) are in perfect bullish alignment, with the shorter-term MAs trading above the longer-term ones, and all slopes pointing upward. The 20-EMA at $4,208 is currently acting as robust, dynamic support. The overall signal from moving averages remains a Strong Buy.
- Relative Strength Index (RSI - 14-day): The RSI is currently positioned around 62.367, an ideal reading that confirms strong momentum without being excessively overbought (which typically occurs above 70). This suggests there is ample room for the price to run higher before facing exhaustion.
- MACD (Moving Average Convergence Divergence): The MACD line remains above the signal line, with the histogram registering positive values. This confirms the dominance of the bullish momentum.
- ADX (Average Directional Index): The ADX is currently around 27.6, indicating a well-established and strengthening trend, providing a high-confidence technical signal for the ongoing ascent.
The Dubai Angle: Gold Rates and Local Market Dynamics
The global XAU/USD trend directly dictates local Dubai Gold Rates. On December 5, 2025, the local price of 24-karat gold (a benchmark for the Dubai Gold Market) has been tracking the global increase, rising towards AED 508 per gram.
For investors and traders in the UAE, the current setup presents a strategic opportunity:
- Hedge Against Dollar Weakness: The expectation of a weaker US Dollar directly translates to stronger purchasing power for AED-denominated gold buyers.
- Seasonal Demand: The typical increase in seasonal demand (festive and wedding seasons) in the Middle East and Indian subcontinent provides an additional, localized demand floor for physical gold.
- Gold Trade, Dubai Advantage: Our local pricing model allows for timely execution against global price movements, enabling our clients to capitalize on the expected breakout towards $4,300.
Conclusion: Strategy for Gold Trade Clients
The technical blueprint for gold on December 5, 2025, is overwhelmingly bullish. A temporary pause and slight correction toward the $4,208 support level should be viewed as a tactical buy-on-dip opportunity, not a reason for bearish concern.
Recommended Trading Strategy:
- Position: Maintain a Long position with a tight stop-loss below the major support at $4,180.
- Primary Target: $4,300 (R2).
- Breakout Confirmation: A 4-hour or daily candle close above $4,245 provides the high-conviction signal for the immediate rally toward the primary target.
The path of least resistance for XAU/USD remains to the upside. The combination of dovish central bank expectations and a strong technical structure suggests gold is on track for a powerful closing to 2025.
Disclaimer: This Gold Technical Analysis Report is for informational purposes only and does not constitute financial advice. Past performance is not indicative of future results. Clients should consult with a financial professional before making any investment decisions, particularly concerning precious metals investing.
« Back to News & Reports List