December 31, 2025
Silver Technical Analysis Report – 31 Dec 2025: The Year of the "White Metal" Super-Cycle
Read the definitive Silver Technical Analysis Report for 31 Dec 2025. Discover why XAG/USD surged 160% YTD, key 2026 price forecasts, and strategic insights from Gold Trade, Dubai.
As the final bells of 2025 ring across the Dubai Financial District, one asset stands undisputed as the "Performer of the Year." While gold enjoyed a historic rally, Silver (XAG/USD) has undergone a structural revaluation that few predicted. From a modest start of approximately $30 per ounce in January, the white metal embarked on a parabolic journey, briefly touching an all-time high of $84.00 in late December before a healthy year-end correction.
At Gold Trade, we have monitored this "Silver Super-Cycle" closely. This report provides a comprehensive technical and fundamental autopsy of the 2025 rally and a strategic roadmap for what many analysts are calling the "Price Discovery Phase" of 2026.
2025: A Year of Triple-Digit Gains
For the first time in over a decade, silver has stepped out of gold's shadow. As of December 31, 2025, Silver is trading near the $72.30 mark, representing a staggering 160% year-to-date increase. This outperformance has been driven by a rare convergence of monetary easing and an insatiable industrial appetite.
The Performance Snapshot
- 2025 Opening Price: ~$30.00
- 2025 All-Time High: $84.15 (reached Dec 24)
- Current Spot Price (31 Dec): $72.33
- Performance vs. Gold: Silver outperformed gold by nearly 2:1 in percentage terms.
Technical Analysis: Breaking the 13-Year Ceiling
The most significant technical event of 2025 was the definitive breach of the $50.00 - $54.00 resistance zone. This region had acted as an impenetrable ceiling since 2011. Once cleared in mid-2025 via a massive Cup and Handle pattern, the market entered a vacuum of supply.
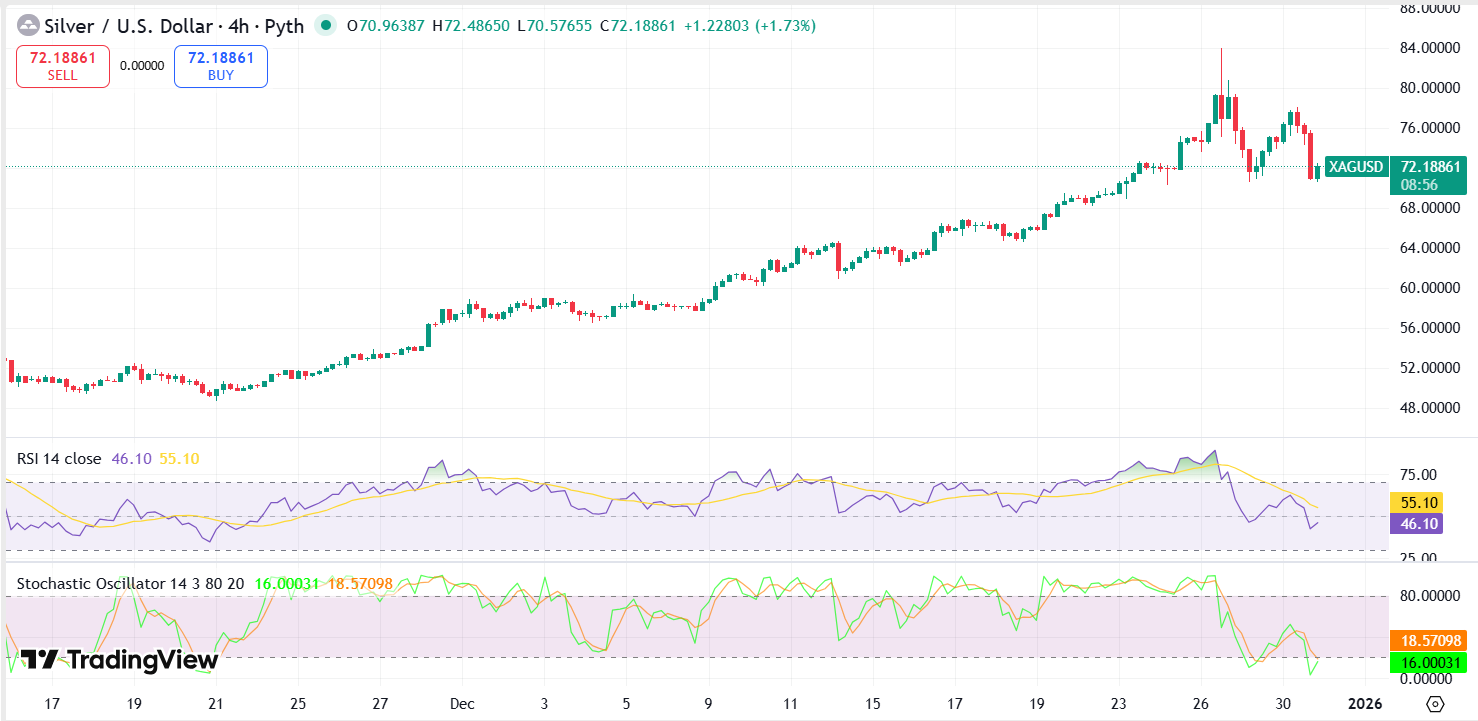
The Daily Chart: Consolidation or Peak?
On the daily timeframe, silver is currently undergoing a sharp "mean reversion" after reaching extreme overbought levels. The 14-day Relative Strength Index (RSI) , which peaked at a dizzying 88.0 last week, has finally cooled to 55.0, suggesting that the speculative "froth" has been liquidated.
Key Indicators to Watch
- Exponential Moving Averages (EMA): The price is currently testing the 20-day EMA ($71.80) . As long as XAG/USD holds above this level on a daily closing basis, the "parabolic" structure remains intact.
- CME Margin Impact: The recent 9% drop from the highs was triggered by the CME Group’s decision to hike margin requirements for silver futures to $25,000 per contract. This forced highly leveraged "weak hands" out of the market, creating a more sustainable floor for 2026.
- Fibonacci Levels: The current pullback aligns perfectly with the 38.2% Fibonacci retracement of the Q4 rally. Support at $68.50 remains the "Golden Zone" for institutional re-entry.
The Gold-Silver Ratio: The Great Compression
The Gold-Silver Ratio—a metric that measures how many ounces of silver it takes to buy one ounce of gold—has been the ultimate signal for Dubai-based investors this year.
Starting the year at a historically "cheap" 85:1, the ratio plummeted to as low as 62:1 in December. This contraction signifies that silver is finally catching up to gold’s valuation, reflecting its dual role as a precious store of value and an essential industrial commodity.
Fundamental Drivers: The Industrial Trifecta
Beyond the technicals, the "Dubai Silver Surge" is anchored in physical reality. We are entering 2026 with the fifth consecutive year of a structural silver deficit, currently estimated at 100 million ounces.
1. The Solar Boom
Silver is the best conductor of electricity on Earth. In 2025, the solar PV sector accounted for nearly 30% of total global silver demand. As the EU and China accelerate their 2030 green mandates, the demand for high-efficiency N-type solar cells is making silver "non-substitutable."
2. The AI & Data Center Revolution
Perhaps the most overlooked catalyst of 2025 was the massive expansion of AI data centers. The high-performance connectors and cooling systems required for AI chips have created a new, price-insensitive demand source. With IT power capacity growing 50x since 2000, silver is now being reclassified as a "Critical Tech Mineral."
3. China’s Export Restrictions
Starting January 1, 2026, China is expected to implement new licensing requirements for silver exports. As one of the world's largest hubs for refined silver, this "Geopolitical Reset" could create a massive supply shock in the London and Comex vaults, potentially driving prices toward the $90.00 mark in Q1 2026.
Strategic Support and Resistance for Jan 2026
For clients of Gold Trade, the following levels define the trading range for the start of the New Year:
| Level Type | Price Point (USD) | Technical Significance |
|---|---|---|
| Major Resistance (R2) | $84.15 | The 2025 All-Time High; the ultimate target for bulls. |
| Immediate Resistance (R1) | $78.00 | The post-correction lower high; a break here signals the rally is back. |
| Pivot Point | $72.00 | The current battleground; psychological and EMA support. |
| Primary Support (S1) | $65.00 | The previous breakout zone; heavy institutional "buy-the-dip" orders. |
| Critical Support (S2) | $60.00 | The 50-day SMA; the line in the sand for the long-term bull market. |
The Dubai Perspective: Investing in Physical Silver
In Dubai, the "City of Gold," we have seen a significant shift in portfolio allocation. Traditional gold investors are now diversifying 15-20% of their holdings into silver bullion.
At Gold Trade, we have noted that physical premiums in the UAE have remained high despite the paper market volatility. This "disconnect" between the London spot price and physical delivery costs suggests that the real-world scarcity of silver is much tighter than the futures market reflects.
"2025 was the year silver broke its chains. For 2026, we aren't looking at whether silver will rise, but how high it can go before the supply crunch forces a total market reset." — Chief Market Strategist, Gold Trade, Dubai.
2026 Outlook: The Road to $100?
As we look ahead to 2026, the technical "roadmap" suggests that the current correction is a gift for long-term holders. With the Federal Reserve expected to continue rate cuts in response to a softening job market, and the USD Index (DXY) trending lower, the macroeconomic tailwinds are formidable.
Our base-case projection for Q1 2026 is a retest of the $84.00 ATH, followed by a move into the $95.00 - $105.00 extension zone by mid-year.
Conclusion: A Golden Opportunity in Silver
The year 2025 will be remembered as the moment silver finally reclaimed its throne. While volatility remains high, the structural deficit and technical breakout from a decade-long base suggest this bull market is only in its second inning.
At Gold Trade, we remain committed to providing our clients with the most accurate, real-time data to navigate these historic markets. Whether you are looking at physical bars or digital silver contracts, the time to position for the 2026 "Supply Squeeze" is now.
Disclaimer: Trading in precious metals involves risk. This analysis is for educational purposes and does not constitute financial advice. Always consult with a certified financial advisor before making investment decisions.
« Back to News & Reports List