January 06, 2026
Silver Technical Analysis Report: The "White Metal" Eyes $80 Amid Global Supply Shock – January 06, 2026
The global precious metals market has ignited in the first trading week of 2026, with silver stealing the spotlight from its yellow counterpart. As of today, Tuesday, January 06, 2026, silver (XAG/USD) is trading at a staggering $78.30 per ounce, marking one of the most explosive starts to a fiscal year in commodity history. For investors at Gold Trade, this surge represents a critical intersection of technical breakout patterns and unprecedented geopolitical instability.
In this exclusive technical report, we analyze the factors driving silver toward the psychological $80.00 barrier and what the "Dubai Premium" tells us about the physical market's health.
Market Overview: The $78.30 Breakout
Silver has transitioned from a volatile speculative asset into a strategic cornerstone for 2026 portfolios. After a historic 2025 that saw the metal gain over 140%, many analysts predicted a cooling period. Instead, the market opened 2026 with a "gap-up," fueled by a supply-side crunch that has left industrial buyers scrambling for physical delivery.
Current Silver Rates in Dubai (Jan 06, 2026)
In the Dubai markets, the appetite for physical silver remains at record highs. At Gold Trade, we are seeing a significant influx of institutional interest in silver bars as a hedge against currency debasement.
| Silver Purity / Type | Price (AED) | Price (USD) |
|---|---|---|
| Silver Spot (per oz) | AED 287.60 | $78.30 |
| 1kg Silver Bar (999) | AED 9,245.50 | $2,517.50 |
| Silver 925 (per gram) | AED 8.45 | $2.30 |
Fundamental Catalysts: The "Venezuela Shock" and AI Demand
To understand the technicals, one must first look at the "Black Swan" events of the last 48 hours. The January 2026 Venezuela Crisis—following reports of U.S. military strikes and the capture of President Maduro—has sent safe-haven demand into a frenzy.
Beyond geopolitics, the AI Industrial Super-Cycle has reached a tipping point. Silver’s role as the most conductive metal on earth makes it indispensable for the high-efficiency semiconductors used in AI data centers. In 2026, the industrial deficit is projected to exceed 200 million ounces, a structural imbalance that technical charts are now pricing in.
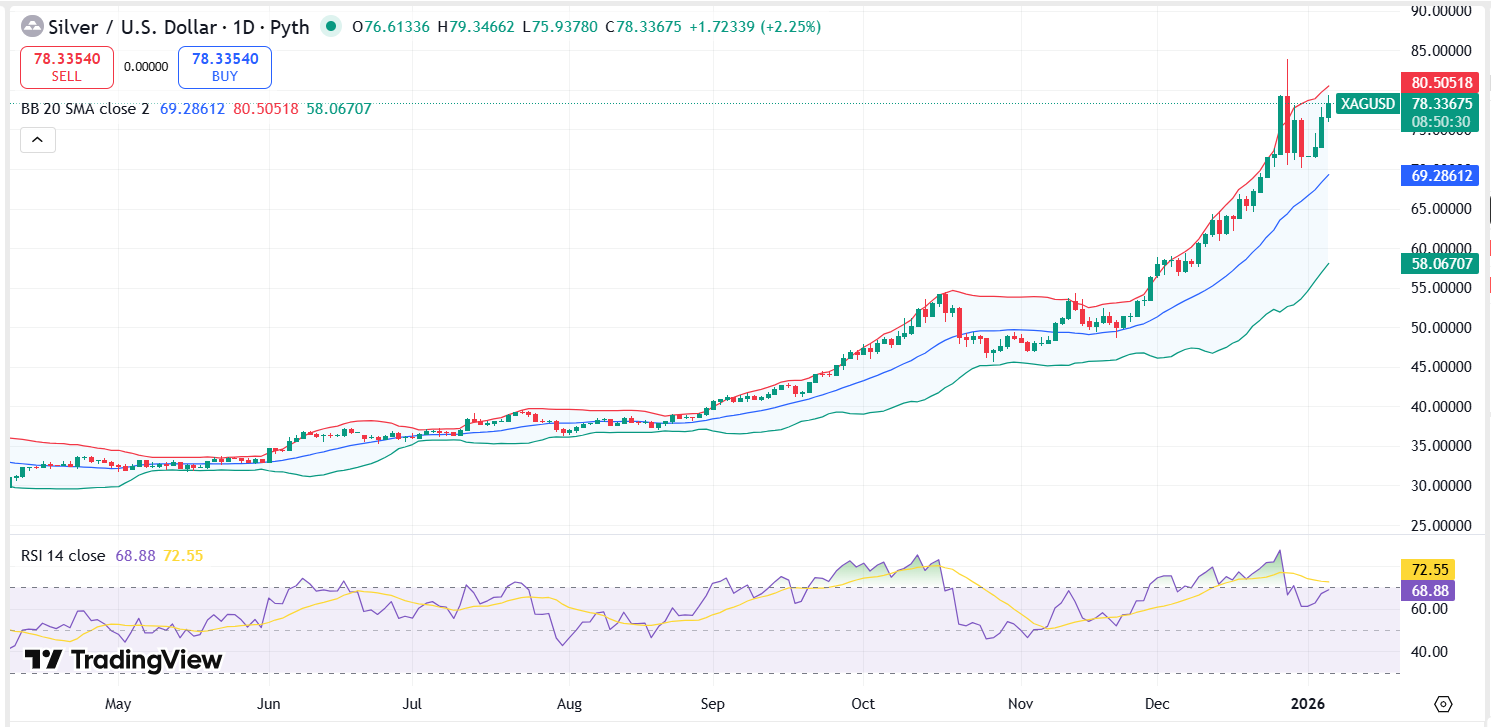
Technical Analysis: XAG/USD Price Action
From a purely technical standpoint, silver is currently in a "Price Discovery" phase. Having shattered the multi-year resistance at $50 in 2025, the metal is now navigating uncharted territory.
1. Key Support and Resistance Levels
The current price of $78.30 puts silver within striking distance of a major milestone.
- Immediate Resistance ($80.00 - $81.50): The $80.00 level is the primary psychological barrier. A daily close above this mark would likely trigger an automated "buy-stop" frenzy, clearing the path toward the $88.00 Fibonacci extension level.
- Secondary Resistance ($84.00): This represents the brief "spike high" seen in late December. If bulls can reclaim this level, the $100 forecast for late 2026 becomes a statistical probability.
- Primary Support ($75.00): Formerly a formidable resistance zone, $75.00 has now flipped into a solid floor. Any intraday dip toward this level is currently being met with aggressive "buy-the-dip" orders from Dubai-based funds.
- Structural Support ($70.00): This remains the "line in the sand." As long as silver trades above $70, the long-term parabolic trend is considered healthy.
2. Technical Indicators & Oscillators
The data suggests a market that is "running hot" but still possesses upward momentum.
- Relative Strength Index (RSI): The 14-day RSI is currently at 72.4. While this is technically "overbought" (anything above 70), in a hyper-bull market like 2026, indicators can stay overbought for weeks. However, it does warn traders that a short-term "flash correction" to $72 could occur to flush out weak hands.
- Moving Averages: Silver is trading significantly above its 50-day EMA ($68.50) and 200-day EMA ($54.20) . The widening gap between the price and these averages confirms the strength of the current trend but also suggests that the market is stretched.
- MACD (Moving Average Convergence Divergence): The MACD histogram is expanding in the positive territory, and the signal line is trending steeply upward, indicating that the buyers are firmly in control of the tape.
The "Dubai Factor": Physical Squeeze and Premiums
At Gold Trade, we have observed a unique phenomenon on January 06: the Shanghai-Dubai Premium. Physical silver in eastern hubs is trading at a $8 to $10 premium over London spot prices. This "physical squeeze" suggests that paper silver (futures) is struggling to keep pace with the actual demand for bullion.
"The divergence between paper contracts and physical availability has never been wider. In Dubai, we are seeing investors opt for 1kg and 5kg bars at a rate that suggests they expect $100 silver by mid-year." — Market Analyst, Gold Trade Dubai.
Strategic Outlook for Q1 2026
The technical setup for January 2026 favors the bulls, but caution is advised near the $80.00 mark.
Why the Bull Run May Continue:
- Central Bank Diversification: It’s not just gold anymore. Central banks in the BRICS+ nations have begun including silver in their "strategic metal" reserves.
- Solar Mandates: With the EU’s new 2026 solar integration mandate for new buildings, the demand for silver paste is inelastic.
- Monetary Policy: The Federal Reserve’s commitment to rate cuts in early 2026 has lowered real yields, making non-yielding silver more attractive than ever.
Potential Risks:
- Margin Hikes: Exchanges like the COMEX may increase margin requirements to curb volatility, which could cause a temporary "liquidation dip."
- Profit Taking: After a move from $30 to $78 in 12 months, large institutional players may decide to lock in gains at the $80 level.
Conclusion: Is $100 Silver the Next Stop?
As of January 06, 2026, the technical evidence points to a continued upward trajectory. While an RSI reading of 72 suggests a period of consolidation is healthy, the fundamental "supply-demand" gap is too large for a sustained crash. For the Dubai investor, silver remains the "asymmetric trade" of the decade.
At Gold Trade, we recommend monitoring the $75.00 support zone for entry points. If the market successfully converts $80.00 into support by the end of this week, the "Road to $100" will be wide open.
Disclaimer: Trading in precious metals involves risk. This analysis is for educational purposes and does not constitute financial advice. Always consult with a certified financial advisor before making investment decisions.
« Back to News & Reports List