January 06, 2026
Gold Technical Analysis Report: Dubai Market Trends & Global Forecast – January 06, 2026
The global gold market has entered 2026 with an unprecedented surge, solidifying its status as the ultimate hedge against a backdrop of shifting geopolitical alliances and evolving monetary policies. For investors and traders at Gold Trade, the current price action represents more than just a rally; it is a structural shift in the valuation of the yellow metal. As of today, January 06, 2026, spot gold is testing critical psychological barriers, driven by a "perfect storm" of macro-economic catalysts.
In this comprehensive technical analysis, we break down the latest price trends, support and resistance levels, and the unique factors driving the Dubai gold market this Tuesday.
Market Snapshot: Gold’s Explosive Start to 2026
Gold prices opened the first trading week of 2026 with remarkable strength, building on a stellar 2025 performance that saw the metal rise by over 60%. Following the reopening of global markets, XAU/USD surged to find a new trading floor above the $4,350 mark.
Current Dubai Gold Rates (Jan 06, 2026)
In Dubai, the "City of Gold," retail prices reflect the international bullish sentiment. As of this morning, the rates at Gold Trade are as follows:
| Gold Purity | Price per Gram (AED) |
|---|---|
| 24K Gold | AED 538.25 |
| 22K Gold | AED 498.25 |
| 21K Gold | AED 477.75 |
| 18K Gold | AED 409.50 |
Note: Prices are subject to intra-day market fluctuations.
Fundamental Catalysts: The Venezuela Factor and The Fed
While technical patterns dictate the timing of entries, fundamental drivers are currently providing the "fuel" for the fire. Two major events have dominated the headlines this morning:
- Geopolitical Shock in South America: Over the weekend, reports of a U.S.-led military operation in Venezuela and the capture of President Maduro have sent shockwaves through the commodities market. Venezuela holds some of the world’s largest untapped gold reserves (estimated at 161 metric tonnes). The resulting instability has revived safe-haven demand, pushing investors away from risk assets and into bullion.
- Federal Reserve Dovishness: The minutes from the most recent FOMC meeting suggest that the Fed is committed to its path of interest rate cuts. With three successive cuts already behind us entering 2026, the opportunity cost of holding non-yielding gold continues to drop, while a softening US Dollar (DXY) makes gold cheaper for international buyers in Dubai and beyond.
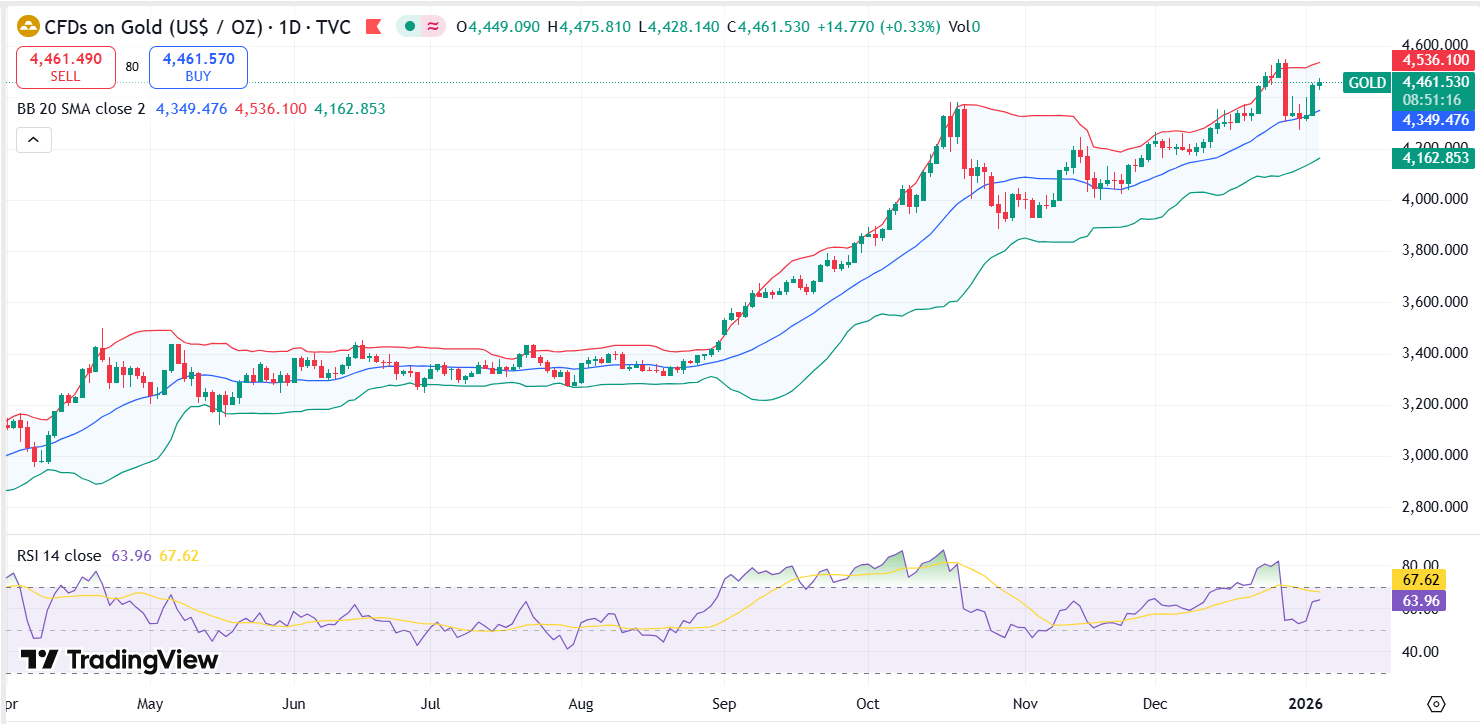
Technical Analysis: Breaking Down the XAU/USD Chart
From a technical perspective, gold is navigating a "blue sky" territory but faces immediate resistance near its all-time highs.
Support and Resistance Levels
Traders should monitor the following key price levels for the upcoming sessions:
- Immediate Resistance ($4,435 - $4,546): This zone represents the high-water mark established in late December 2025. A sustained daily close above $4,500 would likely trigger a massive short-squeeze, clearing the path toward the psychological $5,000 milestone.
- Pivot Point ($4,360): The current market price is hovering above this pivot. Staying above this level confirms the intraday bullish bias.
- Key Support ($4,300): This is the "line in the sand" for short-term bulls. A break below $4,300 could signal a healthy consolidation phase, leading prices toward the 50-day Exponential Moving Average (EMA).
- Major Structural Support ($4,200): This level aligns with former resistance and the primary upward trendline. As long as gold stays above $4,200, the long-term bull market remains firmly intact.
Momentum Indicators
- Relative Strength Index (RSI): The RSI is currently reading 68, which is approaching the "overbought" threshold (above 70). While this indicates strong buying pressure, it also warns of a potential short-term pullback or "cooling off" period before the next leg up.
- MACD (Moving Average Convergence Divergence): The MACD histogram has shown a bullish crossover on the 4-hour chart. The signal line is trending upward above the zero level, confirming that the path of least resistance remains to the upside.
Why Dubai Gold Trade is Dominating the 2026 Market
Dubai continues to serve as the global hub for physical gold trading. Despite the record-high prices, demand at Gold Trade remains resilient.
The "Dubai Premium" and Transparency
Investors are increasingly turning to Dubai because of the stringent regulatory framework and the transparency of the Dubai Gold & Jewellery Group. In an era of global economic uncertainty, the ability to purchase physical bars and coins with verified purity is a primary driver for institutional and retail investors alike.
De-Dollarization and Central Bank Reserves
A significant portion of the 2026 rally is attributed to central banks in emerging markets diversifying their reserves away from the US Dollar. Experts at Gold Trade, Dubai note that the trend of "de-dollarization" has shifted from a theoretical concept to a structural reality, with central banks projected to accumulate over 800 tonnes of gold this year.
Expert Outlook: Where is Gold Heading?
Leading financial institutions have revised their 2026 forecasts upward in light of the January surge:
- Goldman Sachs: Targets $5,055 by Q4 2026, citing strong Western ETF inflows.
- J.P. Morgan: Predicts an average price of $5,000 for the year, driven by "unprecedented institutional conviction."
- Local Dubai Analysts: Many local experts believe that while a minor correction to $4,150 is possible due to profit-taking, the underlying demand from the jewelry sector and retail investors in India and China will provide a solid floor.
"Gold is no longer just a defensive asset; in 2026, it has become a strategic performance driver for modern portfolios." — Gold Trade Market Insight.
Strategic Summary for Investors
For those looking to enter the market on January 06, 2026, the strategy should be one of "buying the dips." While the current price of AED 538.25 (24K) is at a historic peak, the technical structure suggests that we are still in the early-to-middle stages of a multi-year bull cycle.
Key Takeaways:
- Watch the $4,300 level: If prices hold here, the momentum is aggressively bullish.
- Diversify your holdings: Consider a mix of physical bars and digital gold certificates to maximize liquidity.
- Stay informed: Geopolitical developments in Venezuela and US inflation data later this week will be the primary volatility drivers.
As we progress through the first month of 2026, Gold Trade remains committed to providing our clients with real-time data and expert technical insights to navigate these historic market conditions.
Disclaimer: Trading gold and other commodities involves high risk and may not be suitable for all investors. This report is for informational purposes only and does not constitute financial advice.
« Back to News & Reports List