January 15, 2026
Gold Technical Analysis Report – 15 Jan 2026: XAU/USD Eyes $4,700 as Global Geopolitical Risks Peak
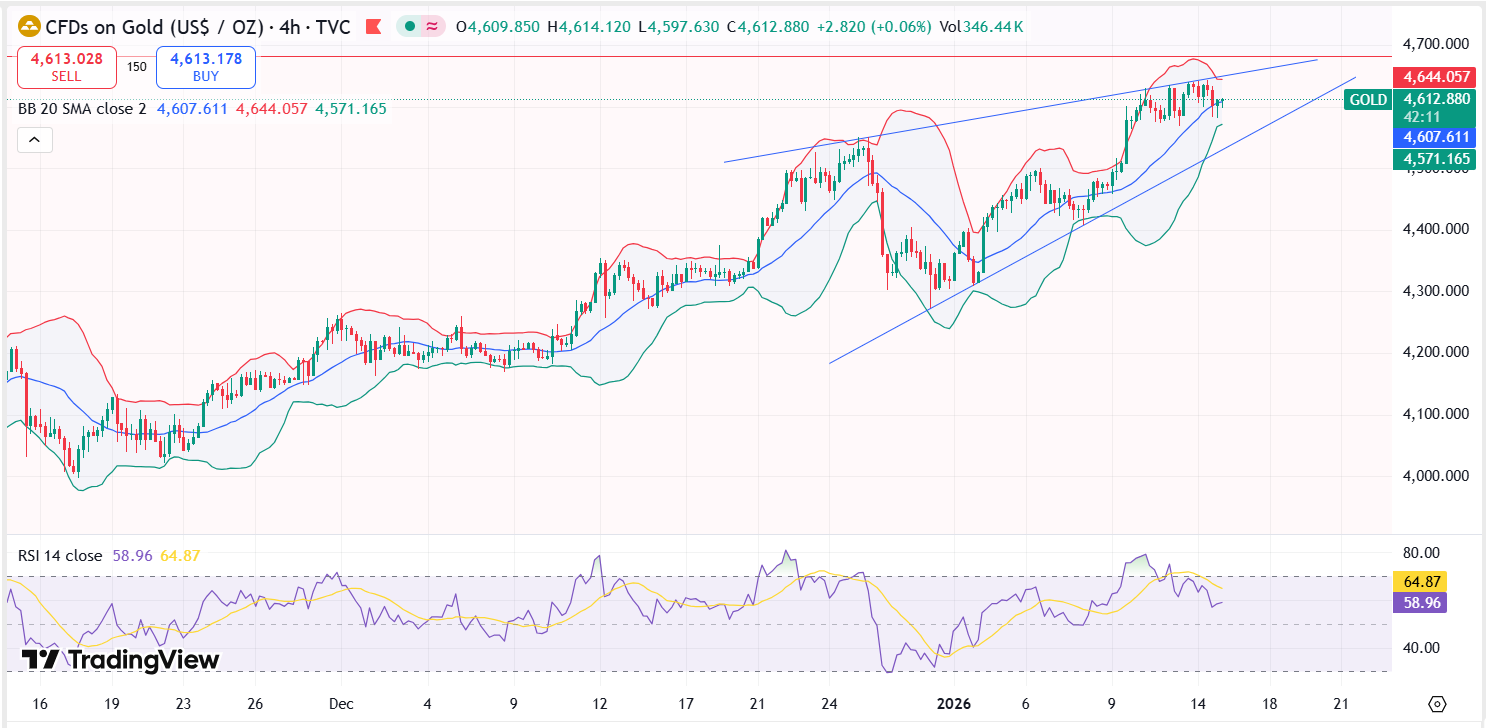
Dubai, UAE – The bullion market has entered a historic phase of price discovery this January, with gold prices smashing through psychological barriers at a pace rarely seen in commodity history. As of January 15, 2026, the "City of Gold" is witnessing an unprecedented surge in demand, as spot gold (XAU/USD) stabilizes near $4,610 per ounce following a record-breaking session that saw the metal touch an intraday high of $4,639.64.
At Gold Trade, Dubai, our technical desk has analyzed the current trajectory, identifying a robust bullish structure that remains intact despite short-term profit-taking. This report provides an in-depth look at the technical indicators, fundamental catalysts, and local Dubai market rates shaping the landscape today.
Market Snapshot: The State of Gold in Q1 2026
The transition from 2025 to 2026 has been nothing short of legendary for precious metals. After a year where gold gained over 60%, the momentum has carried into the new year, fueled by a "perfect storm" of monetary uncertainty and shifting geopolitical alliances.
| Indicator | Value (15 Jan 2026) | Trend |
|---|---|---|
| Spot Gold (XAU/USD) | $4,612.50 | Bullish |
| Dubai 24K Gold (per gram) | AED 553.00 | Near to All-Time High |
| RSI (14-Day) | 54.3 | Neutral/Consolidating |
| Immediate Resistance | $4,635.00 | High-Volume Node |
| Key Support | $4,550.00 | Pivot Zone |
Fundamental Drivers: Why Gold is Defying Gravity
Before diving into the charts, it is essential to understand the macro backdrop driving this technical breakout.
1. The Federal Reserve Independence Crisis
Market volatility spiked this week following news of a criminal investigation into Federal Reserve Chair Jerome Powell regarding his June testimony. This has raised existential questions about the independence of the U.S. central bank. When the autonomy of the world’s reserve currency issuer is called into question, capital flows naturally migrate toward the ultimate "hard asset"—gold.
2. Geopolitical Volatility and the "Trump Factor"
With President Trump back in the spotlight, his recent commentary on regional conflicts in the Middle East and Eastern Europe has kept the safe-haven bid alive. While some reports suggest a "wait-and-see" approach, the mere potential for U.S. involvement in Iran’s internal unrest has pushed institutional hedgers to increase their bullion allocations.
3. Central Bank De-dollarization
The Gold Trade research team notes that central banks in emerging markets—specifically the BRICS+ nations—have continued their aggressive shift away from U.S. Treasuries. In 2025, gold surpassed Treasuries as a percentage of global reserves for the first time in decades, a trend that is accelerating in early 2026.
Technical Analysis: Charting the Path to $5,000
From a technical perspective, the XAU/USD chart is a textbook example of a sustained uptrend. However, the internal mechanics suggest a brief period of "cooling off" before the next leg up.
The Rising Price Channel
On the 4-hour and Daily charts, gold is trading within a well-defined ascending channel. The rejection at $4,635 on January 14 aligns perfectly with the upper boundary of this channel. We are currently seeing a healthy "retest" of the mid-channel line, which sits near $4,580.
Moving Averages: The Golden Foundation
- 50-Day SMA: Currently tracking near $4,415.
- 200-Day SMA: Positioned at $4,325.
The widening gap between the price and its moving averages indicates strong momentum. However, a "mean reversion" to the 21-day EMA ($4,480) would not be surprising and should be viewed by investors as a prime buying opportunity rather than a trend reversal.
Momentum Indicators (RSI & MACD)
The Relative Strength Index (RSI) has dipped from an overbought reading of 78 down to 54.3. This is a bullish signal for the medium term, as it shows that the market has cleared out excess "froth" without breaking the price structure. Meanwhile, the MACD histogram remains in positive territory, though the signal lines are beginning to flatten, suggesting a consolidation phase between $4,570 and $4,620 over the next few trading sessions.
Dubai Retail Market: Local Impact
Dubai remains the premier destination for physical gold acquisition. At Gold Trade, we are seeing a surge in retail traffic as local residents and tourists react to the AED-denominated prices.
"Even with gold at record dollar highs, the Dubai market continues to offer a strategic advantage due to the city's tax-efficient structure and competitive premiums," says our Chief Market Strategist.
Current Dubai Gold Rates (15 Jan 2026):
- 24K Gold: AED 553.00
- 22K Gold: AED 512.25
- 21K Gold: AED 491.00
- 18K Gold: AED 421.00
The breach of the AED 550 mark for 24K gold is a significant psychological milestone for local investors. We anticipate that if global spot prices hit our Q1 target of $4,712, Dubai retail rates could approach AED 580 per gram.
Strategic Outlook: Short-Term vs. Long-Term
For Short-Term Traders
The strategy for the remainder of January 15 and 16 should be "Buy on Dips."
- Entry Zone: $4,575 - $4,585
- Stop-Loss: $4,545 (below the major pivot)
- Target: $4,635 and $4,660
For Long-Term Investors
Despite the high price point, the structural deficit in the physical market (exacerbated by silver’s supply constraints) suggests that the peak has not yet been reached. Institutional forecasts from J.P. Morgan and Morgan Stanley have been revised upward, with many analysts now eyeing $5,000/oz by the fourth quarter of 2026.
At Gold Trade, we recommend a Dollar Cost Averaging (DCA) approach. Building a position in 24K bullion bars during these consolidation phases ensures exposure to the long-term hedge against currency devaluation.
Conclusion: A New Era for Bullion
The Gold Technical Analysis Report for 15 Jan 2026 confirms that while the rally may be taking a breather, the bulls are still firmly in control. The convergence of geopolitical tension, central bank buying, and a technically sound "higher-high" structure points toward continued appreciation.
Investors should keep a close eye on the U.S. Dollar Index (DXY) and the upcoming CPI inflation prints. Any sign of cooling inflation might paradoxically boost gold further if it leads to more aggressive Fed rate cut expectations for March.
Disclaimer: The information provided in this Gold Technical Analysis Report is for educational purposes only and does not constitute financial advice. Trading gold and precious metals involves significant risk. Investors should conduct their own research or consult with a professional financial advisor before making any investment decisions.
« Back to News & Reports List