January 15, 2026
Silver Technical Analysis Report – 15 Jan 2026: XAG/USD Battles Volatility as It Eyes the $100 Milestone
Dubai, UAE – While gold has historically been the primary focus for investors in the Middle East, the first two weeks of 2026 have belonged undeniably to silver. As of January 15, 2026, the global "white metal" market is experiencing a level of price discovery not seen in nearly half a century. At Gold Trade, our technical desk is tracking a historic surge that has seen Silver (XAG/USD) appreciate by over 20% year-to-date, far outstripping the gains of its yellow counterpart.
Currently, spot silver is stabilizing near $89.41 per ounce, following an explosive intraday session on January 14 where it breached the $92.00 psychological barrier for the first time in history. This report provides a comprehensive technical and fundamental breakdown of why silver is the "metal to watch" this quarter and what it means for investors in the Dubai bullion market.
Market Performance Snapshot (15 Jan 2026)
The transition into 2026 has been defined by a narrowing Gold-to-Silver ratio and a massive influx of retail and institutional capital into physical silver ETFs and bars.
| Key Indicator | Value (15 Jan 2026) | Market Sentiment |
|---|---|---|
| Spot Silver (XAG/USD) | $89.41 | Bullish (Consolidating) |
| Dubai Silver Rate (999/kg) | AED 11,300.00 | All-Time High |
| Gold-to-Silver Ratio | 51.4 | Significant Compression |
| Primary Resistance | $92.00 | Multi-Year High |
| Major Support | $84.00 | Bullish Pivot Zone |
Fundamental Catalysts: The Silver "Supply Shock"
The technical breakout we are witnessing is underpinned by the most severe structural deficit in the silver market's history. At Gold Trade, we believe three primary factors are fueling this "moonshot" trajectory.
1. The 5th Consecutive Year of Supply Deficit
Data from the Silver Institute indicates that 2026 marks the fifth year where global demand exceeds mine supply. With China imposing strict export restrictions on silver late in 2025 to protect its own industrial needs, the "deliverable" supply in London and New York has plummeted to decade lows.
2. The AI and Green Energy "Loading"
The solar photovoltaic (PV) sector and the burgeoning AI data center industry are consuming silver at an unprecedented rate. High-efficiency semiconductors and massive electricity loads for AI cooling systems require silver's superior conductivity.
"In 2026, silver is no longer just a monetary asset; it is a critical strategic industrial commodity. There is simply no substitute for its conductive properties in the green revolution," notes our Senior Market Analyst.
3. Geopolitical Risk and "Safe-Haven" Rotation
With the current political uncertainty surrounding the Federal Reserve’s independence and regional instability in the Middle East, investors are rotating out of high-yield bonds and into the "poor man's gold." The perception of silver as an undervalued hedge is driving a massive catch-up trade.
Technical Analysis: Breaking Down the XAG/USD Chart
From a technical perspective, silver is in an accelerated uptrend. However, the current price action suggests that the metal is entering a "cooling" phase—a necessary development to sustain long-term growth.
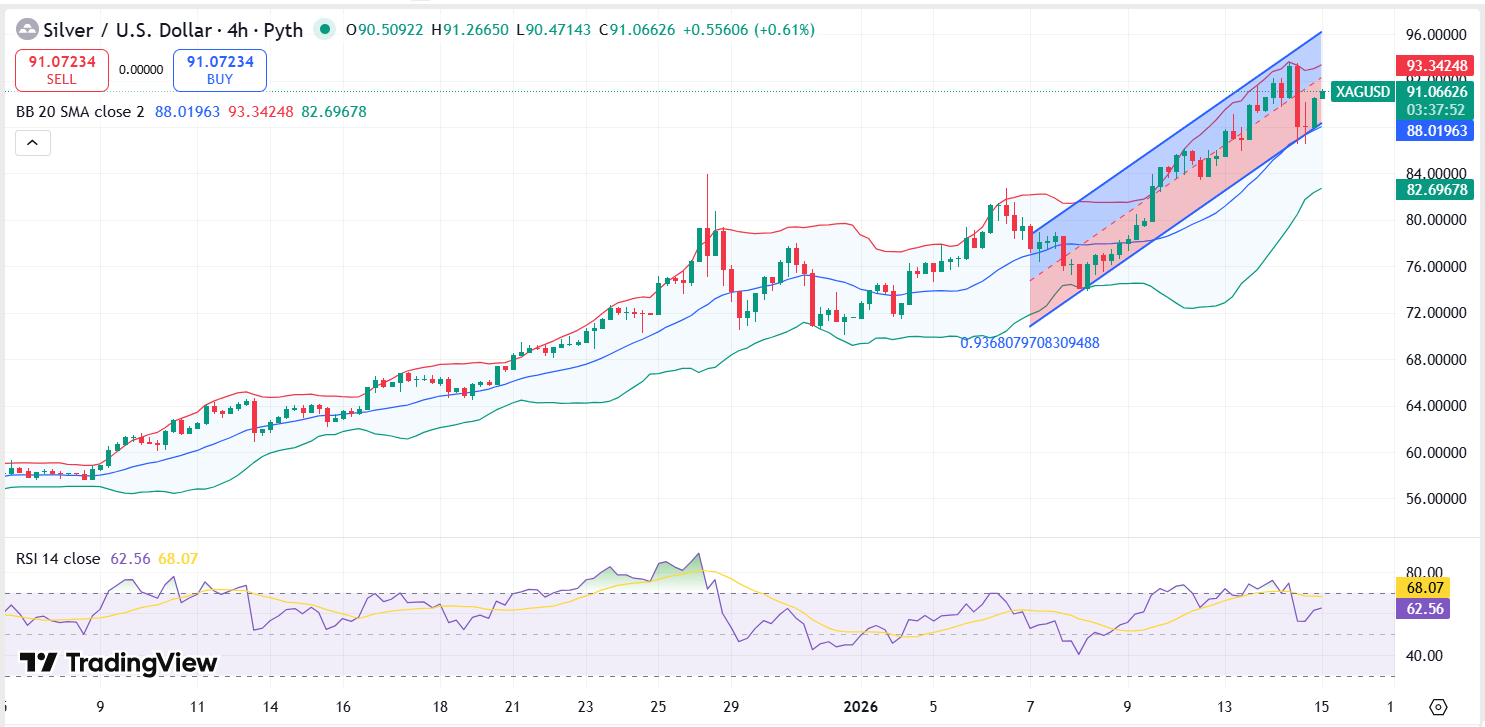
The Ascending Channel and Price Discovery
Since breaching the decade-long ceiling of $50 in late 2025, silver has entered a pure price discovery mode. On the daily chart, XAG/USD is trading within a steep ascending channel. The rejection at $93.61 on Wednesday indicates that the market is respecting the upper boundary of this channel. We are currently seeing a retest of the $86.00 – $88.00 support cluster.
Moving Averages: A Golden Gap
- 20-Day EMA: $76.85
- 50-Day SMA: $68.40
- 200-Day SMA: $52.10
The significant distance between the current price ($89.41) and the 200-day moving average ($52.10) signals that the market is "stretched." This often precedes a period of sideways consolidation or a sharp, healthy pullback to allow the moving averages to catch up.
Momentum Indicators (RSI & MACD)
The 14-day Relative Strength Index (RSI) reached a peak of 82.4 earlier this week, firmly in overbought territory. However, it has since cooled to 71.2. More importantly, we are observing a bearish divergence on the hourly charts—where price made a new high but the RSI did not. This suggests that the immediate upward momentum is tiring, and a dip toward the $84.03 level is highly probable within the next 48 to 72 hours.
The MACD (Moving Average Convergence Divergence) remains positive, but the histogram bars are beginning to shorten, reinforcing the view that the "buying frenzy" is taking a temporary breather.
The Dubai Advantage: Local Market Dynamics
Dubai remains at the heart of the physical silver trade. In the Dubai Gold Souk and through Gold Trade's digital platforms, we have seen a 300% increase in silver bar sales compared to Q1 2025.
Local Price Conversion (AED):
With the USD/AED peg at 3.674, the current silver price of $89.41 translates to approximately AED 328 per troy ounce. For retail investors in the UAE, the 1kg silver bar (999.0 purity) is currently retailing at approximately AED 10,545, excluding VAT and premiums.
The narrowing of the Gold-to-Silver ratio to 51:1—its lowest since 2013—is a major talking point in Dubai. Historically, when this ratio collapses, silver performs as the high-beta version of gold, offering significantly higher percentage returns for local portfolios.
Strategic Outlook and Trading Plan
For Aggressive Traders (Short-Term)
If you are looking to trade the current volatility, the strategy is "Buying the Retest."
- Entry Target: $86.20 - $87.00
- Stop-Loss: $83.50 (protection against a deeper correction)
- Exit Target: $95.00 (the next psychological resistance)
For Wealth Preservation (Long-Term)
For long-term investors at Gold Trade, the current price of $89 may seem high, but the fundamental supply gap suggests that $100 or even $120 is achievable by the end of 2026.
- Recommendation: Avoid "chasing" the green candles. Instead, utilize a Laddered Entry strategy, buying in increments of 10% on every $5.00 dip in spot prices.
Conclusion: Silver’s Path to Triple Digits
The Silver Technical Analysis Report for 15 Jan 2026 confirms a market that is fundamentally undersupplied and technically overheated. While a short-term correction toward $84.00 would be healthy, the long-term trajectory remains aggressively bullish. The convergence of AI-driven demand, green energy mandates, and a weakening confidence in fiat currencies has placed silver in a historic bull run.
At Gold Trade, we remain committed to providing the most accurate, real-time data to help our clients navigate these volatile but rewarding markets. Whether you are looking for physical silver kilobars or digital bullion exposure, the current trend suggests that the "Grey Metal" is no longer just an alternative—it is a necessity.
Disclaimer: This report is for informational purposes only and does not constitute financial advice. Trading in precious metals involves risk. Always consult with a professional financial advisor before making investment decisions.
« Back to News & Reports List