June 19, 2026
Gold Technical Analysis Report: XAU/USD Stabilizes Near $4,154 After Hawkish Fed Outlines Third Weekly Decline – June 19, 2026
Dubai, UAE — The international bullion market is enduring a major structural reassessment as the first half of 2026 draws to a close. Today, June 19, 2026, spot gold (XAU/USD) is locked in a tight, volatile intraday range, swinging between a low of $4,121 and a high of $4,213 per ounce. Currently trading at approximately $4,154 per ounce, the precious metal is on track for its third consecutive weekly decline, facing relentless pressure from a combination of a robust US dollar and a hawkish macroeconomic shift.
At Gold Trade Dubai, our senior market analysts view this current cycle as a natural "liquidity reset." The combination of an unexpected hawkish update from the US Federal Reserve and cooling energy markets following the recent US-Iran geopolitical agreement has temporarily stripped gold of its inflation premium, sparking deep value hunting right above the multi-month structural floor.
Market Summary: The June 19 Landscape
The global spot price drop to $4,154 has triggered significant price adjustments on domestic retail exchanges. In the local UAE market, retail rates for 24K gold dropped below the crucial psychological barrier of AED 500 per gram early Friday morning, touching an attractive AED 496.75 per gram before hovering slightly back to the AED 502.00 level.
This major drop has opened a significant valuation gap compared to Asian markets like India, where 24K gold is hovering around ₹145,850 per 10 grams. Transformed at current exchange rates (1 AED = ₹25.69), buying physical bullion in Dubai provides an impressive savings advantage of roughly ₹17,630 per 10 grams, sustaining the city's historic reputation as the world's ultimate physical gold buying hub.
Technical Analysis: Key Support and Resistance Zones
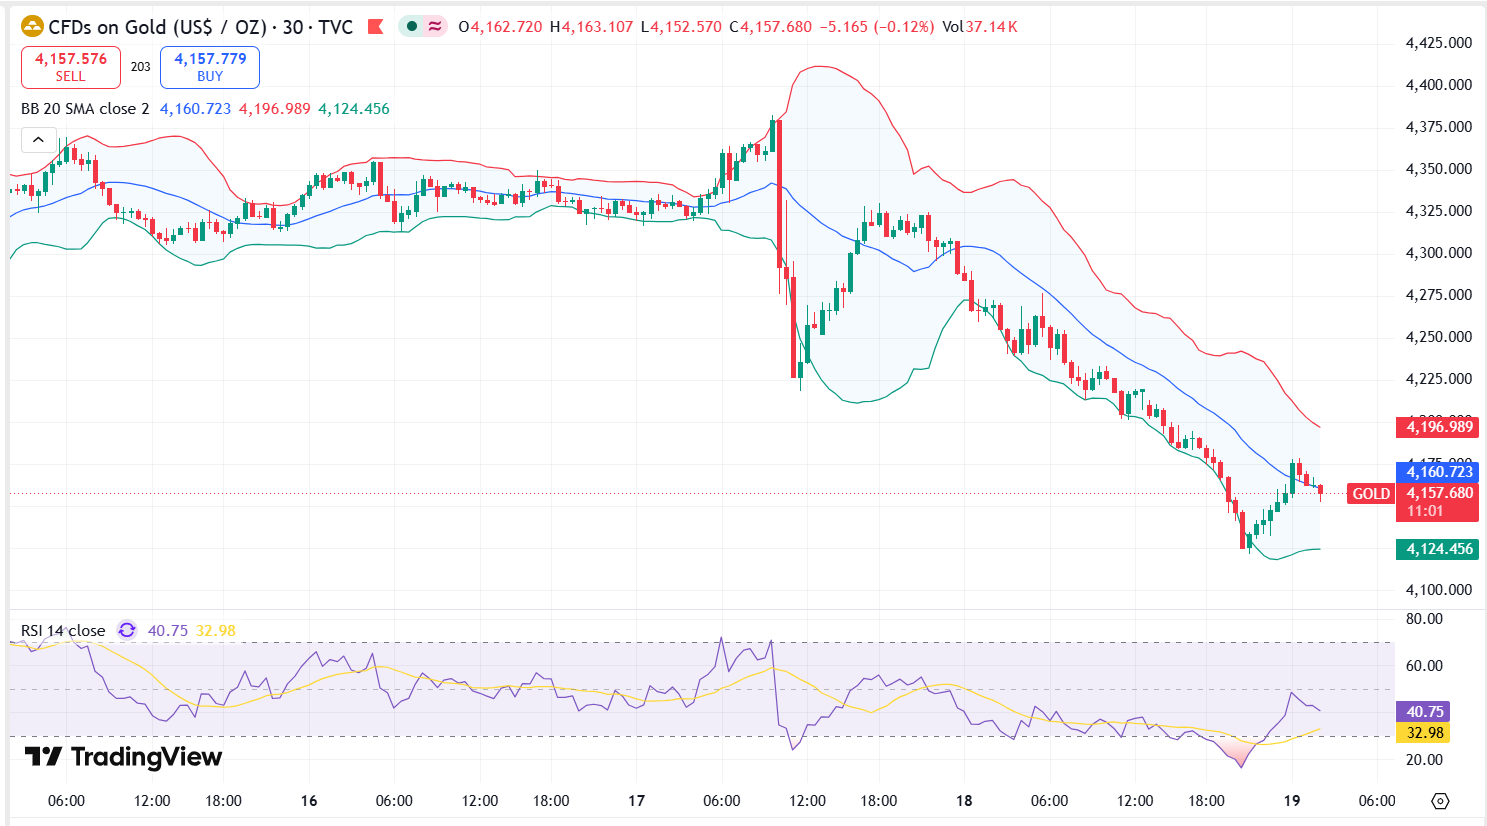
The technical landscape on the H4 and daily charts confirms that XAU/USD is navigating a corrective downtrend, but signs of a structural bottom are emerging near today's low.
| Resistance 2 | $4,300 |
| Resistance 1 | $4,213 |
| Immediate Support | $4,145 |
| Structural Floor | $4,121 |
1. Support Structures: Testing the $4,121 Baseline
- The Intraday Low ($4,121): Today's floor at $4,121 represents a critical interception point. This area is heavily defended by long-term institutional buyers and aligns closely with the major intra-year low of $4,170 tested earlier this quarter.
- The H4 Pivot ($4,145): On shorter timeframes, the $4,145–$4,160 zone serves as an immediate demand pocket. If gold closes a daily candle below $4,121, it risks opening the floodgates for a technical extension down toward the ultimate psychological baseline of $4,020.
2. Resistance Barriers: The $4,213 Hurdle
- The Intraday High ($4,213): To crack the short-term bearish cycle, the bulls must forcefully clear the daily swing high of $4,213. This line marks the entry point into a broader consolidation channel.
- The Primary Trendline Ceiling ($4,300): A structural trend reversal can only be confirmed if XAU/USD manages to scale past the upper Bollinger Band boundary situated between $4,275 and $4,300. This major barrier is heavily reinforced by the 200-day Simple Moving Average (SMA), which sits near $4,340.
Momentum Indicators: Oversold Signals Flashing
To evaluate the internal strength of today's price action, our technical desk highlights key momentum oscillators:
- Relative Strength Index (RSI): The 14-day RSI has dropped into the 32.0–35.0 range. This indicates that the market is rapidly approaching deeply oversold conditions. Historically, when the RSI stretches this low during a structural bull market, a sharp corrective rebound follows within days.
- MACD (Moving Average Convergence Divergence): The MACD remains trapped in negative territory beneath the zero line. However, the bearish histogram bars have begun losing depth over the last 12 hours, revealing that selling momentum is slowing down.
Institutional Sentiment: A Healthy Shakeout Before the Run to $6,000?
While short-term futures traders are panicking over the Fed’s "higher for longer" inflation rhetoric, institutional "smart money" is actively accumulating physical stock. Following the correction, premier investment bank Goldman Sachs subtly adjusted its year-end price forecast to $4,900 per ounce (down from $5,400) to account for delayed interest rate cuts. Conversely, analysts at J.P. Morgan Global Research maintain a deeply bullish structural stance, forecasting gold to average $6,000 per ounce in Q4 2026, with an extended upside reaching $6,300 by late 2027.
The foundation of this institutional long case remains tied to strong alternative trade flows. While public central bank registries showed surface-level sales in early Q1, Swiss refinery exports and London over-the-counter (OTC) market data revealed that true global physical collection rose to 244 tonnes in the last macro quarter. Furthermore, Chinese net imports inflected up by nearly three times quarter-on-quarter to 317 tonnes, demonstrating massive sovereign diversification into gold as an elite reserve asset.
Local Retail Dynamics: The "Dubai Advantage"
At our corporate headquarters at Gold Trade, our floor has witnessed a massive influx of retail and institutional buyers over the last 24 hours. The drop below AED 500 per gram has unleashed an immense wave of physical buying from local family offices and international travelers. Because the UAE Dirham is strictly pegged to the US Dollar, local buyers are entirely shielded from emerging market currency devaluations, making the physical acquisition of 24K kilobars a premier capital preservation strategy in June 2026.
Actionable Strategy for Precious Metals Investors
| Strategy Type | Target Level (USD) | Tactical Recommendation |
|---|---|---|
| Conservative Buyer | $4,121 – $4,145 | Ideal accumulation window to scale into long-term spot holdings. |
| Momentum Trader | $4,213 | Await a verified H4 candle break above this level before targeting $4,300. |
| Risk Management | $4,120 | Place hard structural stop-loss limits below today's daily low. |
Conclusion: Accumulation Season Is Underway
The Gold Technical Analysis Report for June 19, 2026, reveals a market that has flushed out speculative leverage, leaving the commodity perfectly priced for long-term investors. Trading at $4,154, the asset is currently resting inside a high-conviction demand zone. While the stronger dollar might limit immediate vertical breakouts over the weekend, the massive gap between western paper liquidations and intense eastern physical demand indicates a strong bottom is being formed.
For the partners and clients of Gold Trade, the message is clear: short-term macro noise is presenting a classic, highly liquid buying window before the primary bull market resumes its journey toward the forecasted $6,000 year-end targets.
About Gold Trade Dubai
Gold Trade Dubai is an elite bullion and financial commodity enterprise based in the United Arab Emirates. Operating from Dubai's premier gold souq zones, we offer real-time technical tracking, and direct global execution for physical gold and silver portfolios.
Financial Disclaimer: This technical report is strictly intended for educational and market analysis purposes and does not constitute formal investment advice. Trading spot commodities involves substantial capital risk. All investors are urged to conduct independent research or speak with a licensed UAE financial professional before entering the market.
« Back to News & Reports List