June 24, 2026
Gold Technical Analysis Report: XAU/USD Under Intense Pressure Near $4,058 as Aggressive Fed Rate Hikes Fuel Dollar Breakout – June 24, 2026
Dubai, UAE — The international precious metals market is navigating its most severe multi-week correction in a decade. On Wednesday, June 24, 2026, spot gold (XAU/USD) experienced accelerated selling pressure, dropping through crucial multi-month floors to navigate an intraday trading range of $4,052 to $4,116 per ounce. Currently trading at approximately $4,058 per ounce, bullion is on track to close out the June quarter down nearly 12%, wiping out its early-year gains and putting major long-term moving averages to the ultimate test.
According to the analytical desk at Gold Trade, this severe capitulation phase is driven by a powerful macro dynamic. The primary catalyst is a massive multi-month breakout in the US Dollar Index (DXY), which recently hit a fresh one-year high.
This dollar surge is backed by rising market conviction that the US Federal Reserve—under the staunchly hawkish leadership of its new chairman, Kevin Warsh—will implement three aggressive interest rate hikes before the end of the year to choke off persistent inflation. Furthermore, conflicting signals surrounding the fragile US-Iran peace roadmap have triggered a cooling trend in crude oil prices (with Brent dropping below $78), significantly lessening the immediate demand for gold as a structural inflation hedge.
Market Overview: The June 24 Liquidity Flush
The sudden breakdown to $4,058 has had an immediate impact on physical gold rates across regional trading hubs. In the local UAE market, retail prices for 24K investment gold have slipped to AED 493.25 per gram, presenting a sharp contraction from the AED 519.25 high recorded on June 18.
For international retail buyers and cross-border arbitrage investors, this correction expands the historic "Dubai Advantage." On physical bullion exchanges in India, 24K gold continues to command a steep domestic premium, trading close to ₹152,470 per 10 grams.
When converted at the current exchange rate of 1 AED = ₹25.89 , a physical purchase of 10 grams of 24K gold at Gold Trade equates to roughly ₹125,050. This translates to a massive purchasing spread of nearly ₹27,420 per 10 grams in favor of buying physical bullion directly in Dubai.
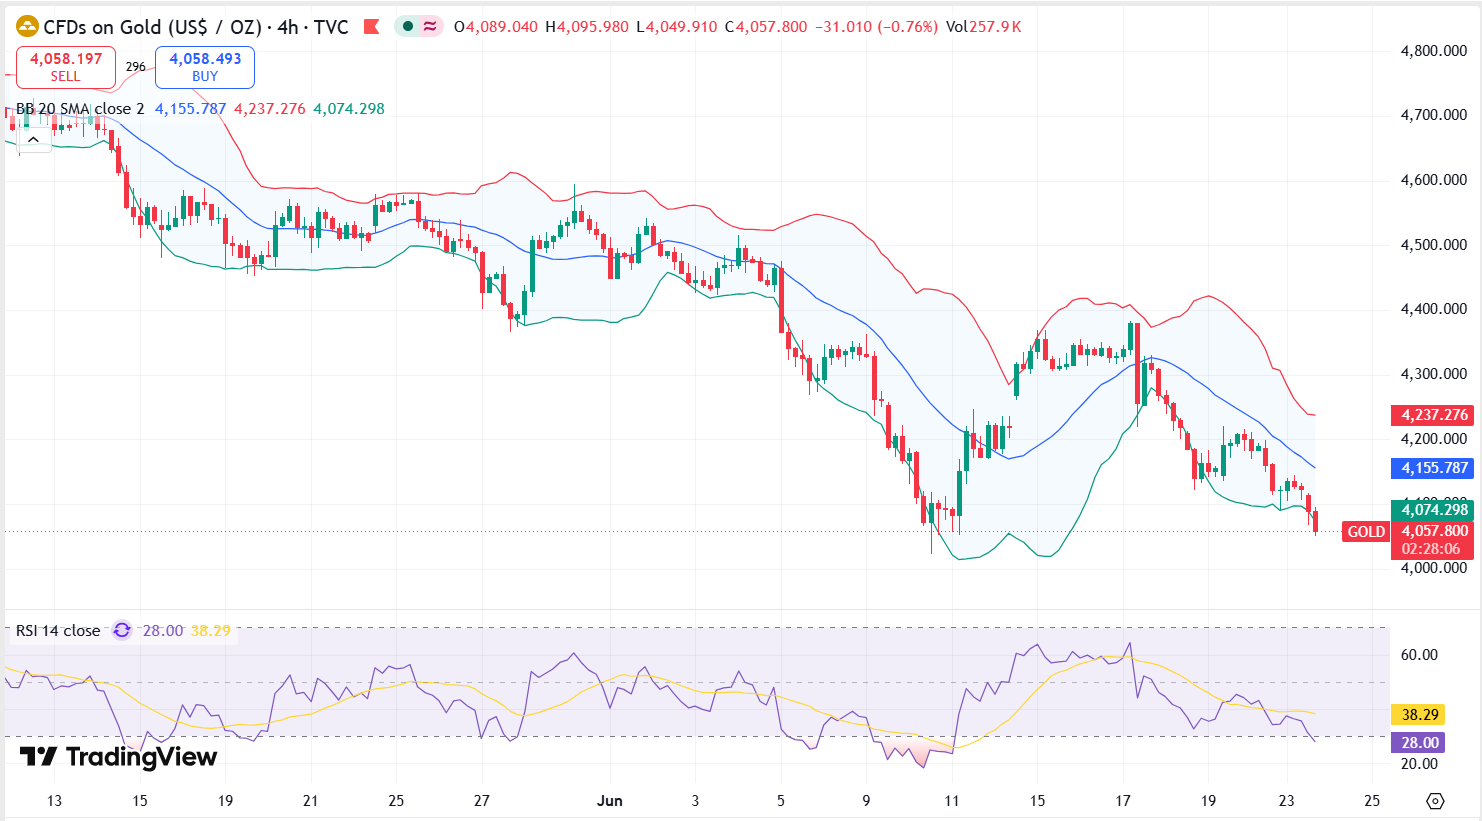
Technical Analysis: Mapping the Crucial Inflection Zones
The structural chart pattern of XAU/USD reveals that the metal has slipped below its 25-day, 50-day, and 100-day Simple Moving Averages (SMAs). This technical breakdown has shifted short-term momentum completely to the side of the bears, concentrating all attention on the final structural floor.
| Major Resistance 2 | $4,170 |
| Immediate Resistance 1 | $4,116 |
| TRADING CURRENTLY AT | $4,058 |
| Crucial Support 1 | $4,052 |
| Ultimate Macro Floor | $4,000 |
- Support Boundaries: The Fight for the $4,000 Milestone
- The Daily Session Low ($4,052): Today's intraday bottom at $4,052 represents the initial point of structural defense. This zone is a vital technical cushion that must hold on a daily closing basis to prevent panic liquidations.
- The Psychological Floor ($4,000): If the $4,052 level gives way, the market will likely see an algorithmic slide directly into the $4,000 psychological barrier. Institutional "buy walls" are highly concentrated around this major round number, as it aligns with deep historical accumulation blocks from late 2025.
- Resistance Hurdles: Navigating the Recovery Path
- The Session Ceiling ($4,116): The initial milestone for a bullish intraday reversal sits at the daily high of $4,116. Clearing this boundary is mandatory to stop the immediate bleeding.
- The Descending Trendline Layer ($4,170): A meaningful short-term trend shift will require a breakout over the $4,170–$4,192 consolidation zone, which previously acted as an absolute floor before turning into a rigid overhead ceiling.
Momentum Oscillators: Deeply Oversold Territory
- Relative Strength Index (RSI): The 14-day RSI has dropped sharply to 27.5, officially locking gold into deeply oversold territory. Historically, an RSI reading below 30 indicates that a selling trend is mathematically overextended, creating prime conditions for a sharp "short squeeze" or relief rally.
- MACD (Moving Average Convergence Divergence): The MACD line is extended far below its signal line in deeply negative territory. While the momentum is heavy, the widening distance between the lines typically precedes a sharp macro compression or architectural turn.
Institutional Sentiment: Drastic Target Cuts vs. The Sovereign Bid
The shifting macro climate has forced major global banking institutions to re-evaluate their near-term projections:
- Deutsche Bank: In a recent research update, Deutsche Bank slashed its short-term price target by over 20%, adjusting its Q3 expectations down to $4,300 per ounce, while warning that a full 4-rate-hike scenario from the Fed could force a brief capitulation down to $3,800.
- Goldman Sachs: Goldman Sachs cut its year-end forecast by $500, establishing a more conservative target of $4,900 per ounce, directly pricing in the reality that the Fed will completely avoid interest rate cuts in 2026.
Despite these near-term commercial banking downgrades, the long-term sovereign structural floor remains remarkably resilient. According to data from the World Gold Council, a record 45% of global central banks intend to expand their physical gold reserves through the remainder of 2026. Sovereign accumulation remains the lone stable pillar absorbing the heavy volume coming out of Western paper-gold exchange-traded funds (ETFs).
Dubai Infrastructure Updates: Launch of Same-Day Settlement
In a strategic response to rising safe-haven demand and shifting liquidity cycles, the Dubai Gold and Commodities Exchange (DGCX) announced the official launch of a same-day settlement gold contract.
The leadership at Gold Trade expects this infrastructure upgrade to draw substantial institutional capital to the region. By facilitating real-time physical settlement, Dubai is actively boosting liquidity and expanding its role as a secure financial sanctuary for global capital escaping Western paper volatility.
Investor Allocation Matrix for June 24
| Market Outlook | Critical Level (USD) | Portfolio Recommendation |
|---|---|---|
| Spot Accumulation | $4,052 – $4,058 | Strong accumulation zone for long-term physical positions leveraging oversold indicators. |
| Breakout Confirmation | $4,116 | Short-term swing traders should wait for a firm H4 candle breakout here. |
| Macro Stop-Loss | $4,000 | Conservative margin accounts should position risk controls beneath this structural floor. |
Conclusion: Capitalizing on the Core Reset
The Gold Technical Analysis Report for June 24, 2026, describes a market undergoing a severe, necessary clearing of speculative leverage. Trading at $4,058, the metal is undeniably facing intense short-term pressure ahead of tomorrow's critical US Personal Consumption Expenditures (PCE) inflation print.
However, with the 14-day RSI screaming oversold and intense physical demand accelerating at our corporate offices across the UAE, Gold Trade views this pricing anomaly as a premier accumulation window. While paper markets focus on hawkish central bank statements, the raw realities of central bank accumulation and regional premium spreads suggest that the current correction is creating a highly secure base for the next major long-term bull market expansion.
Financial Disclaimer: The material presented in this technical report is strictly for educational, news reporting, and general market analysis purposes. It does not constitute formal financial or investment advice. Precious metals trading involves a high level of capital risk. Investors should execute independent risk assessments prior to committing capital to the market.
« Back to News & Reports List