
August 22, 2026
Weekly Gold Technical Analysis Report - 24 to 28 Aug 2026: XAU/USD Eyes $4,650 Following Friday Surge to $4,632 Peak
Publication Date: August 22, 2026
Forecast Horizon: August 24 – August 28, 2026
Publisher: RKV Gold Trade LLC (Dubai, UAE)
Asset Class: Spot Gold (XAU/USD) & Dubai Physical Bullion
Executive Summary & Weekly Market Overview
Spot gold (XAU/USD) closed out the previous trading week on a decisively bullish footing, capped by a powerful Friday rally that breached major psychological resistance levels. During Friday's session, gold opened at $4,519.30 per troy ounce, dipped briefly to an intraday session low of $4,508.78, and subsequently experienced aggressive institutional buying momentum that drove prices to a fresh high of $4,632.22. Spot gold settled into the weekly market close at $4,603.36, marking a single-day gain of +$84.06 (+1.86%) and an overall weekly trading range of $307.48.
As markets transition into the trading week of 24 – 28 August 2026, the key analytical question is whether gold buyers can consolidate above the crucial $4,600.00 pivot floor to mount a breakout attempt toward $4,650.00–$4,700.00. The combination of structural trend continuation, sustained central bank accumulation across the Gulf Cooperation Council (GCC) region, and monetary policy easing expectations continues to keep the macroeconomic macro backdrop firmly supportive of precious metals.
Friday Price Action Breakdown & Weekly Market Structure
Friday’s session delivered a classic expansion phase across intraday and daily charts, characterized by strong dip-buying at the $4,508.78 low followed by sequential upward momentum into the European and American session crossovers.
XAU/USD Friday Trading Session Metrics (Aug 21, 2026 Setup for Aug 24-28 Week)
| Opening Price: | $4,519.30 [Session Baseline] |
| Intraday Low: | $4,508.78 [Primary Demand Floor] |
| Intraday High: | $4,632.22 [Session Resistance Peak] |
| Weekly Close: | $4,603.36 [Structural Equilibrium & 23.6% Fib Zone] |
| Net Single-Day: | +$84.06 (+1.86%) |
| Total Range: | $123.44 |
The rally from $4,508.78 to $4,632.22 cleared multiple technical supply zones, including the prior resistance hurdle at $4,580.00. The slight retracement from $4,632.22 to the $4,603.36 close represents standard weekend profit-taking by short-term derivative market participants rather than structural distribution.
On the 4-hour and daily timeframe charts, gold maintains a well-defined series of higher highs and higher lows, confirming that the primary trend heading into the 24–28 August 2026 trading week remains bullish.
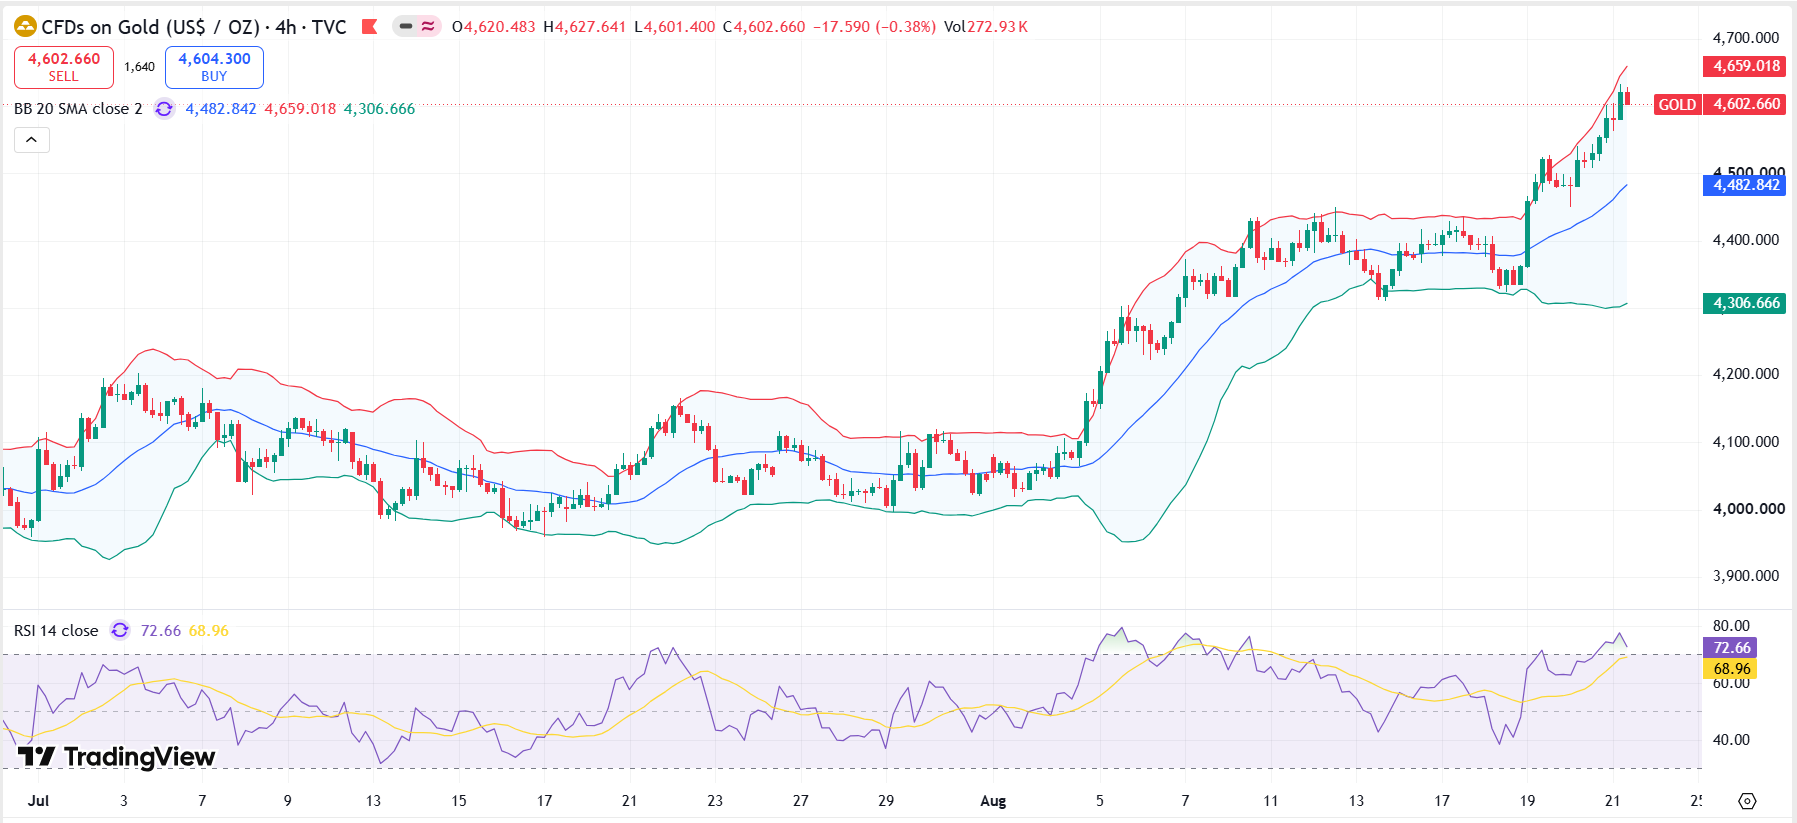
Technical Indicators & Oscillator Confluence
A detailed examination of core technical indicators confirms strong underlying trend integrity while highlighting short-term overbought conditions to monitor during the upcoming week:
- Exponential Moving Averages (EMA): On the daily chart, spot gold trades significantly above its 20-day EMA ($4,525.40), 50-day EMA ($4,440.10) , and 200-day EMA ($4,285.60) . The expanding gap between shorter-term and longer-term EMAs reflects robust upside momentum.
- Relative Strength Index (RSI 14): The 14-day RSI closed the week at 68.40, approaching overbought territory (above 70.00) but remaining below critical divergence thresholds. This indicates that while brief consolidation near $4,600.00 is possible early in the week of 24–28 Aug, buyers retain structural control.
- Moving Average Convergence Divergence (MACD): The daily MACD line remains positioned above the signal line with an expanding positive histogram, signaling strong bullish momentum heading into Monday’s market open.
- Fibonacci Retracement Grid (Friday Range $4,508.78 to $4,632.22):
- 23.6% Retracement: $4,603.09 (Directly matches the Friday close at $4,603.36)
- 38.2% Retracement: $4,585.07 (Immediate intraday pullback support)
- 50.0% Equilibrium: $4,570.50 (Key mid-range demand zone)
- 61.8% Golden Ratio: $4,555.93 (Critical trend preservation barrier)
Weekly Technical Support & Resistance Matrix
The following matrix outlines the key technical levels, pivot barriers, and trading boundaries established for the 24 – 28 August 2026 market week:
| Technical Level | Price (USD/oz) | Market Structure & Significance | Strategic Action |
|---|---|---|---|
| Resistance 3 (R3) | $4,720.00 | Major Fibonacci expansion zone and long-term upside projection | Primary macro target for extended long positions |
| Resistance 2 (R2) | $4,680.00 | Intermediate technical supply channel limit | Secondary resistance target |
| Resistance 1 (R1) | $4,632.22 | Friday session high peak and immediate upside barrier | Key breakout confirmation trigger |
| Weekly Pivot Axis | $4,603.36 | Friday close equilibrium and 23.6% Fibonacci confluence | Directional bias anchor for 24-28 Aug week |
| Support 1 (S1) | $4,550.00 | Confluence of 61.8% Fib retracement and previous breakout structure | Primary buy-on-dip defense zone |
| Support 2 (S2) | $4,508.78 | Friday session low baseline and major structural order block | Key trend invalidation barrier |
| Support 3 (S3) | $4,450.00 | Major psychological demand zone and 50-day EMA alignment | Deep institutional value zone |
Dubai Physical Gold Market & Local AED Pricing Matrix
In Dubai's physical bullion market, international spot gold movements directly determine local wholesale and retail gold rates.
The Friday price surge from $4,519.30 to a peak of $4,632.22, followed by a close at $4,603.36, resulted in significant adjustments on local price boards across the Dubai Gold Souq.
The table below outlines physical gold rates per gram in United Arab Emirates Dirhams (AED) across standard purity levels, comparing prices at the Friday Close ($4,603.36) against the Friday High ($4,632.22) :
| Gold Karat Purity | Fine Gold Content (%) | Price at Friday Close ($4,603.36/oz) | Price at Friday Low ($4,508.78/oz) | Net Intraday Variance (AED/g) |
|---|---|---|---|---|
| 24K Pure Gold | 99.9% | AED 554.75 / g | AED 543.50 / g | AED 11.25 / g |
| 22K Jewellery Standard | 91.67% | AED 513.75 / g | AED 503.25/ g | AED 10.50 / g |
| 21K Regional Standard | 87.50% | AED 492.50 / g | AED 482.50 / g | AED 10.00 / g |
| 18K Commercial Grade | 75.00% | AED 422.25 / g | AED 413.75 / g | AED 8.50 / g |
Physical traders at Gold Trade report that local demand for 1kg 995.0 fine gold bars and kilobar cast bars remained resilient over the weekend, with institutional investors treating prices above AED 543/g as validation of gold's long-term store of value.
Macroeconomic Drivers & Fundamental Catalysts (24 – 28 Aug 2026)
Several macroeconomic drivers are set to influence XAU/USD price action during the upcoming trading week:
- Central Bank Rate Expectations & US Dollar Vulnerability: The US Treasury’s announcement to double the size of its long-term bond buyback program (targeting $4 billion or more per operation for 10-to-30-year maturities) has triggered an immediate and notable shift across global markets. Markets increasingly view these interventions as a sign of structural pressure from soaring US debt levels ($40 trillion+) and heavy issuance. Expectations regarding global monetary policy easing continue to weigh on sovereign bond yields, enhancing the attractiveness of non-yielding bullion. Weakness in the US Dollar Index (DXY) below key technical support continues to act as a direct tailwind for precious metals.
- GCC & Asian Institutional Demand: Central banks and sovereign investment funds across Asia and the Middle East continue to increase physical gold reserves as part of strategic asset diversification. Dubai remains a central distribution hub for physical flows into India and the wider MENA region.
- Geopolitical Risk Premium: Ongoing international trade realignments and maritime security considerations maintain a constant safe-haven bid, ensuring that deep price retracements are rapidly absorbed by institutional buyers.
Tactical Trading Strategies for 24 – 28 August 2026
For the week of 24 to 28 August 2026, market participants at Gold Trade can monitor three strategic trading scenarios based on price behaviour around the $4,603.36 pivot:
Scenario 1: Bullish Breakout (Continuity Strategy)
- Trigger: A 4-hour candle close above $4,632.22 (Friday session high) accompanied by above-average volume.
- Target 1: $4,680.00 (R2 barrier)
- Target 2: $4,720.00 (R3 macro projection target)
- Stop-Loss: $4,595.00 (Below weekly pivot support)
Scenario 2: Dip Accumulation (Value Buy Strategy)
- Trigger: A pullback into the $4,550.00–$4,570.00 demand zone that displays bullish candlestick reversal patterns.
- Target 1: $4,603.36 (Weekly equilibrium level)
- Target 2: $4,632.22 (Retest of session peak)
- Stop-Loss: $4,505.00 (Just below Friday low of $4,508.78)
Scenario 3: Bearish Retracement (Hedge Strategy)
- Trigger: A sustained daily close below $4,508.78 (Friday low baseline).
- Target 1: $4,450.00 (S3 support boundary)
- Target 2: $4,400.00 (Macro structural support)
- Stop-Loss: $4,545.00 (Above broken support level)
Outlook for Gold Trade Clients
The overall technical landscape for the week of 24 – 28 August 2026 favours continued bullish strength. Friday's surge to $4,632.22 and strong close at $4,603.36 reflect genuine buying interest across both derivative and physical markets.
For retail buyers, investors, and corporate clients of Gold Trade in Dubai, physical rates near AED 554.75/g for 24K gold reflect a strong market benchmark. Market participants are advised to exercise disciplined risk management and closely track key pivot levels as trading opens for the week.
Disclaimer: The information provided in this Gold Technical Analysis Report is for educational purposes only and does not constitute financial advice. Trading gold and precious metals involves significant risk. Investors should conduct their own research or consult with a professional financial advisor before making any investment decisions.