
August 18, 2026
Gold Technical Analysis Report – August 18, 2026: XAU/USD Bullish Consolidation Near $4,400 Ahead of Key Macro Drivers
Spot gold (XAU/USD) experienced heightened intraday volatility during today's trading session, surging early to test a peak of $4,436.17 per troy ounce before encountering heavy resistance and pulling back to trade around the $4,390.00 consolidation floor. This sharp $46.17 retracement from session highs reflects immediate profit-taking by institutional short-term market participants, coupled with technical supply emerging near established overhead resistance boundaries. Despite the intraday retreat, the underlying broader structure remains constructive, with market participants evaluating monetary policy signals from the Federal Reserve alongside ongoing safe-haven demand drivers.
The opening hours of the session witnessed aggressive buying pressure that pushed price action through local pivot barriers, briefly signaling a potential bullish breakout continuation toward $4,450.00. However, the inability of buyers to sustain trading volume above $4,430.00 triggered a rapid mean-reversion move, retesting liquidity zones around the $4,390.00 level. This price behavior creates a clearly defined intraday trading range bounded by $4,370.00 on the downside and $4,436.17 on the upside, establishing crucial reference points for both directional breakout traders and range-bound scalpers. Below is the detailed technical breakdown, indicator matrix, and strategic trading scenarios prepared by Gold Trade Dubai.
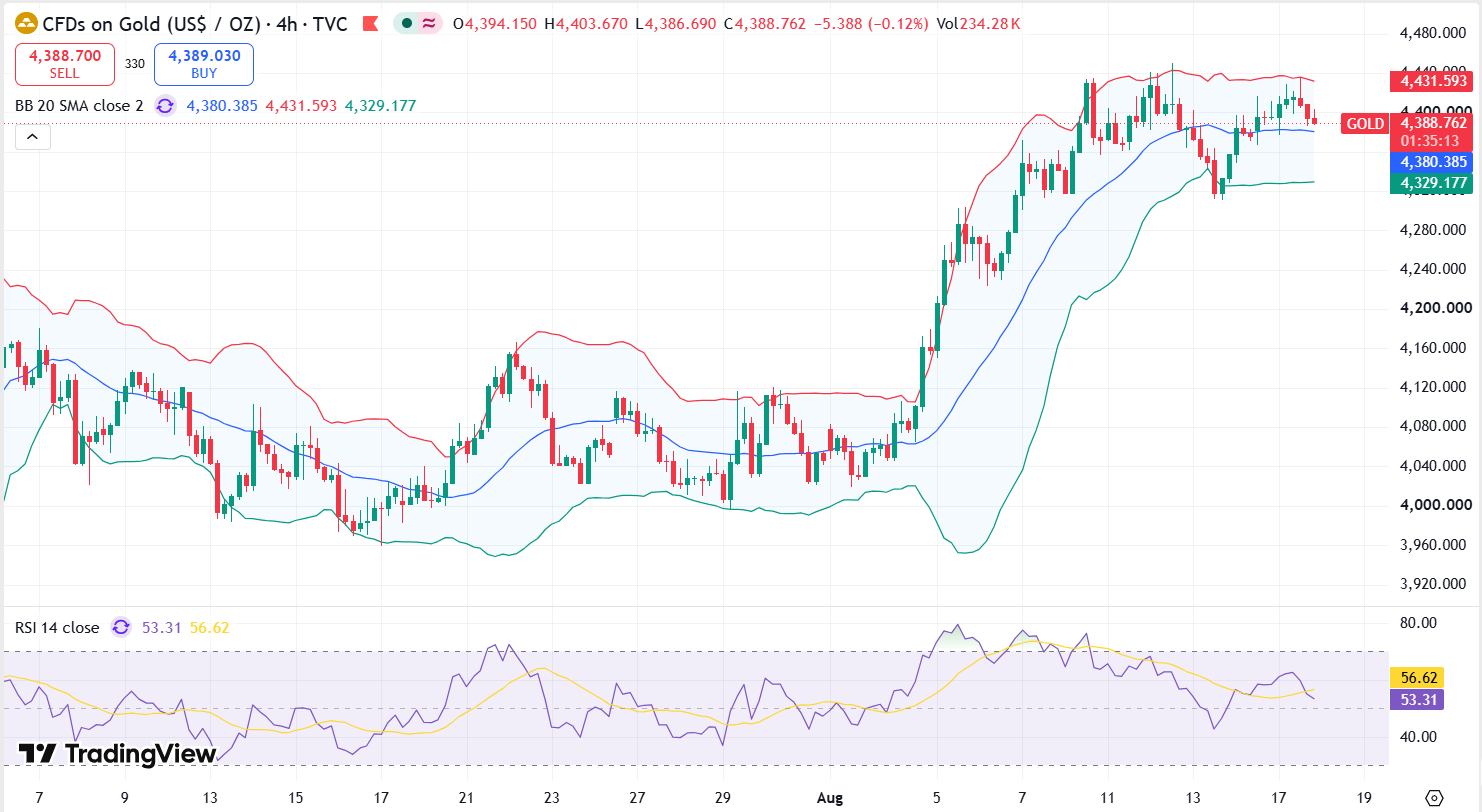
Technical Chart Analysis & Momentum Indicators
From a technical chart perspective, the intraday price action across the 15-minute, 1-hour, and 4-hour timeframes illustrates a multi-stage market progression characterized by expansion, rejection, and structural absorption.
On the shorter 15-minute chart, the early morning ascent formed a sharp ascending channel, culminating in a blow-off spike to $4,436.17. The subsequent decline formed a series of lower highs and lower lows before stabilizing around $4,388.00–$4,392.00, where buyers stepped in to establish an intraday baseline.
On the 1-hour chart, the price continues to trade above key short-term exponential moving averages (EMAs), specifically the 50-period EMA near $4,371.50 and the 200-period EMA near $4,384.50. The spatial alignment relative to these moving averages indicates that the overall intermediate trend remains tilted to the upside, even as the market digests recent rapid gains.
Oscillator signals provide critical context regarding momentum shifts:
- Relative Strength Index (RSI 14): The 14-period RSI spiked into overbought territory above 72.00 during the rally to $4,436.17, signaling temporary momentum exhaustion. The subsequent pullback cooled the indicator back to a balanced reading of 56.16, clearing the overbought condition without plunging into bearish territory. This reset gives bulls technical room to build a fresh base if buying volume returns.
- Moving Average Convergence Divergence (MACD): The MACD line crossed below its signal line on the 15-minute timeframe following the peak, producing a temporary negative histogram expansion. However, on the 4-hour chart, the MACD remains comfortably above the zero line, indicating higher-degree bullish structural integrity.
- Fibonacci Retracement Levels: Mapping the recent intraday swing from the session low near $4,360.00 to the peak of $4,436.17 identifies key retracement zones: the 38.2% retracement sits at $4,407.03, the 50% equilibrium level rests at $4,398.08, and the 61.8% golden ratio support lies at $4,389.13. Current trading near $4,390.00 directly tests this 61.8% structural Fibonacci confluence zone.
Technical Support & Resistance Matrix
To guide tactical trade execution, key horizontal levels, pivot zones, and structural boundaries are detailed below:
| Technical Level | Price (USD/oz) | Structural Description & Market Significance | Tactical Implication |
|---|---|---|---|
| Resistance 3 (R3) | $4,485.00 | Major swing high barrier and expansion target | Key profit-taking target for extended long positions |
| Resistance 2 (R2) | $4,436.17 | Session high supply peak and immediate overhead ceiling | Must be cleared on high volume to confirm bullish continuation |
| Resistance 1 (R1) | $4,410.00 | Intraday breakdown pivot and local supply zone | Immediate hurdle for recovery attempts |
| Current Spot Axis | $4,390.00 | Session equilibrium and 61.8% Fibonacci retracement confluence | Pivot zone for intraday directional bias |
| Support 1 (S1) | $4,370.00 | Intraday demand zone and 50-period 1-hour EMA confluence | Primary defense line for buyers |
| Support 2 (S2) | $4,310.00 | Multi-session swing low and structural order block | Critical support holding the intermediate bullish trend |
| Support 3 (S3) | $4,250.00 | Major psychological floor and moving average area | Deep value zone and institutional demand boundary |
Dubai Physical Gold Market & Local Pricing Breakdown
In the Dubai physical bullion market, international spot price movements directly dictate local wholesale and retail pricing based on the fixed exchange rate of AED 3.6725 per USD. As spot gold reached its session peak of $4,436.17 before settling back to $4,390.00, local price boards across the UAE experienced corresponding adjustments.
The table below illustrates the exact AED pricing per gram across standard karat purities at current spot ($4,390.00):
| Gold Karat Purity | Purity Percentage | Dubai Retal Price |
|---|---|---|
| 24K Pure Gold | 99.9% | AED 529.50 / g |
| 22K Jewellery Grade | 91.67% | AED 490.25 / g |
| 21K Regional Standard | 87.50% | AED 470.00 / g |
| 18K Durable Grade | 75.00% | AED 402.75 / g |
Physical bullion traders in Dubai's Gold Souk trading hubs report that intraday volatility near $4,400.00 has encouraged two distinct market behaviors: retail consumers and jewellery buyers paused purchases during the morning spike toward $4,436.17, while institutional investors and regional bullion desks utilized the subsequent dip back toward $4,390.00 to execute scaled accumulation orders in 1kg 995.0 fine gold bars.
Fundamental Market Catalysts & Macroeconomic Drivers
The macro drivers underlying today's XAU/USD price action reflect a complex interplay between interest rate expectations, currency fluctuations, and global geopolitical dynamics:
- Federal Reserve Monetary Expectations: Markets continue to price in potential monetary easing by the US Federal Reserve. Moderating inflationary pressures combined with softening employment indicators have reinforced trader expectations for upcoming benchmark interest rate cuts. Lower interest rates reduce the opportunity cost of holding non-yielding assets like gold, creating a structural tailwind for spot prices.
- US Dollar Index (DXY) Inverse Pressure: The US Dollar Index experienced modest weakness during early European trading, slipping toward the 99.50 mark before regaining stability around 99.80. Gold's early surge to $4,436.17 directly correlated with the temporary dollar dip, highlighting the persistent inverse sensitivity between XAU/USD and USD strength.
- Geopolitical Safe-Haven Demand: Unresolved tensions in key maritime routes—specifically around the Strait of Hormuz—and ongoing geopolitical friction continue to supply a baseline risk premium. Central banks across emerging markets maintain active net-purchasing programs for physical gold reserves, diversifying away from foreign currency reserves and establishing a firm floor beneath global prices.
Tactical Trading Strategies & Risk Management Framework
Navigating the current price environment near $4,390.00 requires a disciplined risk management approach focused on key pivot triggers:
Bullish Breakout Continuation Setup
- Trigger Condition: A sustained 1-hour candle close above $4,410.00, accompanied by expanding buy volume.
- Target 1: $4,436.17 (retest of session high).
- Target 2: $4,485.00 (macro extension level).
- Stop Loss: $4,385.00 (placed below immediate pivot support).
- Risk/Reward Ratio: Approximately 1:2.5.
Bearish Retracement Setup
- Trigger Condition: A decisive breakdown and 15-minute candle close below $4,370.00.
- Target 1: $4,330.00 (intermediate liquidity pool).
- Target 2: $4,310.00 (major structural support zone).
- Stop Loss: $4,395.00 (placed above current consolidation range).
- Risk/Reward Ratio: Approximately 1:2.4.
Range Consolidation Protocol
- Execution Strategy: Scalping short positions near $4,420.00–$4,430.00 resistance and long positions near $4,375.00–$4,385.00 support while price remains contained within the intraday $4,370.00 to $4,436.17 boundaries.
- Risk Warning: Position sizes should strictly conform to maximum 1–2% account risk per trade given elevated intraday volatility.
Maintaining strict stop-loss discipline remains essential as markets digest upcoming macroeconomic releases and central bank commentary.
For live spot gold quotes, physical bullion trading, and personalized account management in Dubai, contact Gold Trade Dubai.
Disclaimer: This report is prepared by Gold Trade Dubai for informational and analytical purposes only. Technical analysis and price forecasts do not constitute direct financial advice or trading guarantees. Financial markets involve significant risk, and investors should conduct independent analysis prior to executing orders.
« Back to News & Reports List