
September 30, 2026
Gold Market Analysis for Dubai Traders, Investors and Gold Businesses
Gold Technical Analysis Today: 30 September 2026
Gold is entering the final trading session of September 2026 after experiencing a significant correction during the second half of the month. The international gold market has shown substantial volatility, with XAU/USD moving sharply lower before attempting a recovery around the psychologically important 4,200 US dollar area. For gold traders, bullion dealers, jewellery businesses and investors in Dubai, the current market requires close attention to both technical price structure and the fundamental forces influencing precious metals.
The latest market environment is being shaped by several competing factors. Expectations surrounding US monetary policy remain important, Treasury yields are elevated, the US dollar continues to influence international bullion demand, and inflation data are affecting expectations for the Federal Reserve's next decisions. At the same time, geopolitical uncertainty and demand for defensive assets continue to provide a fundamental reason for investors to maintain exposure to gold.
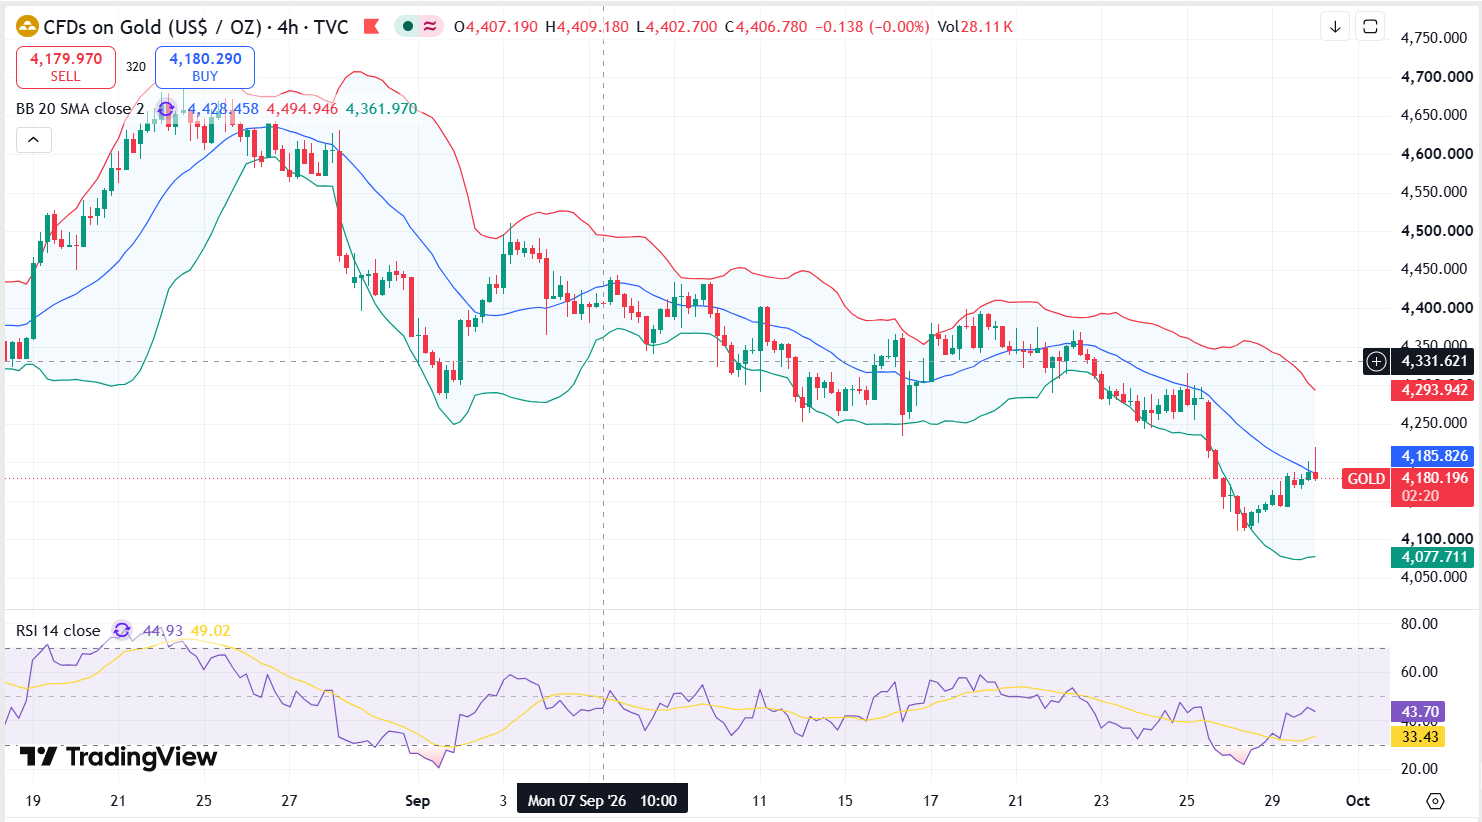
On 30 September, gold recovered after testing the area close to 4,100 dollars per ounce earlier in the week. The recovery accelerated after US inflation information came in softer than some market participants had anticipated. Gold was trading around the 4,200-dollar area during the session, while the broader September performance remained negative.
For Dubai's gold trade, the international XAU/USD price is particularly significant because the UAE market is closely connected to global bullion pricing. Changes in the international gold price can quickly influence the local AED value of gold, although retail jewellery prices can also reflect purity, workmanship, premiums and other commercial factors.
Gold Price Market Structure
The September correction has changed the short-term technical character of the gold market. Earlier strength gave way to aggressive selling, and the market subsequently attempted to stabilize near the 4,100 to 4,200 dollar region.
The first important observation is that gold has demonstrated buying interest after the recent decline. This means that lower prices are attracting market participants. However, a rebound following a sharp fall should not automatically be interpreted as confirmation of a new long-term uptrend. Traders generally need to see sustained higher highs, higher lows and successful recovery of broken technical levels before considering the correction technically complete.
The 4,200-dollar level has become an important psychological reference. Trading above this area can improve short-term sentiment, while repeated failures around this region could encourage sellers to test lower support zones again.
The market is therefore entering a decision area. If buyers can establish gold above the nearby resistance region, the recovery could gain momentum. If sellers regain control and push the metal below recent lows, the correction could extend.
Gold Technical Support Levels
Technical support refers to price areas where buying interest may become stronger after a decline. Support is not a guarantee that the market will reverse, but it provides traders with important reference points for analysing risk and market structure.
4,200 Dollar Area
The 4,200-dollar region is an important short-term reference for XAU/USD. Gold has recently traded around this psychological level during its recovery attempt. Holding above 4,200 could indicate that buyers are attempting to build a base following the recent sell-off.
4,160 Dollar Area
The area around 4,160 dollars is another important short-term reference. A move below this region could weaken the recovery structure and bring renewed attention to the lower part of the recent trading range.
4,110 to 4,100 Dollar Zone
The 4,100 to 4,110 region represents a major short-term support area because the recent decline found buying interest close to this zone. A decisive break below this area would change the immediate technical picture and could increase downside momentum.
4,000 Dollar Psychological Level
The 4,000-dollar level is a major psychological reference for the market. Large round numbers often attract attention from institutional traders, technical analysts and physical-market participants. A move toward this level would represent a significant extension of the current correction.
Gold Technical Resistance Levels
Resistance represents an area where selling pressure may increase as prices recover. The most important resistance zones should be monitored together with trading volume, momentum and the closing position of daily candles.
4,200 to 4,210 Dollars
The first recovery test is located around the 4,200 to 4,210 region. Gold needs to maintain prices above this area to demonstrate that the latest rebound has sufficient strength.
4,230 to 4,250 Dollars
The 4,230 to 4,250 region is a more significant recovery barrier. A sustained move above this area could indicate that buyers are recovering control of the short-term market structure.
4,300 Dollars
The 4,300 level is the next major psychological resistance. If gold successfully moves through the lower resistance areas, traders may focus on this round-number level as the next important test.
Technical levels should always be treated as zones rather than exact numbers. Gold can temporarily move above resistance or below support before reversing. Confirmation through sustained trading and daily closing prices is therefore more useful than relying on a single intraday price movement.
Gold Momentum Analysis
Momentum has weakened considerably compared with the earlier stages of the year's gold advance. The recent decline pushed short-term indicators toward weaker territory, while the rebound from the latest low has started to improve short-term momentum.
The Relative Strength Index can be useful for measuring momentum, but traders should avoid using the indicator in isolation. An oversold reading can identify a market that has experienced heavy selling, but it does not guarantee that prices have reached a durable bottom.
For the current gold market, a more meaningful technical signal would be the combination of improving RSI momentum, a series of higher lows and a sustained recovery above important resistance. Conversely, declining momentum accompanied by a break below recent support would strengthen the case for continuation of the correction.
Moving averages are also useful for identifying the broader trend. Traders can monitor the 20-day, 50-day and 200-day moving averages to determine whether the current rebound is developing into a larger trend reversal or remains a short-term recovery inside a wider correction.
Gold Fundamental Analysis for 30 September 2026
The fundamental outlook for gold is currently being influenced by monetary policy, inflation, bond yields, the US dollar, geopolitical developments and investor demand.
Gold traditionally benefits from uncertainty because investors often use precious metals as a defensive asset. However, gold does not pay interest, which means rising interest rates and higher bond yields can increase the opportunity cost of holding bullion.
This relationship is especially important in the current environment because expectations surrounding the Federal Reserve have been one of the major sources of volatility for XAU/USD.
Federal Reserve Interest Rates and Gold
The Federal Reserve remains one of the most important fundamental influences on the gold market. The US central bank recently moved its policy rate into the 3.75% to 4.00% range, while market participants have continued to assess whether another increase could occur later in the year.
Higher interest rates generally create pressure on gold because investors can obtain greater returns from interest-bearing assets. If markets begin to expect further monetary tightening, Treasury yields and the US dollar can strengthen, creating additional headwinds for gold.
On the other hand, weaker economic data or softer inflation can reduce expectations for additional rate increases. This can lower bond yields and weaken the dollar, creating a more supportive environment for gold.
The latest inflation information has helped gold recover because the data reduced some of the immediate concern about additional monetary tightening. Nevertheless, inflation remains above the central bank's longer-term objective, meaning monetary policy is likely to remain an important market driver.
US Inflation and Gold Price
Inflation is particularly important because gold is frequently viewed as a store of value during periods of declining purchasing power. However, the relationship between inflation and gold is more complicated than simply assuming that higher inflation automatically produces higher gold prices.
When inflation rises, investors may increase demand for gold as a hedge. However, if higher inflation causes central banks to increase interest rates aggressively, the resulting rise in yields can temporarily pressure gold.
The latest US inflation data provided some relief to gold because price pressures were not as strong as some traders had feared. This reduced immediate expectations for another rapid increase in interest rates and helped the precious metal recover from its recent low.
Future inflation reports will therefore remain important for Dubai gold traders because they can produce significant movements in international bullion prices within minutes of publication.
US Dollar Impact on Gold
The US dollar remains one of the most important external variables for XAU/USD. Since international gold is priced in dollars, changes in the value of the currency can influence demand from buyers using other currencies.
A stronger dollar can make gold more expensive for international buyers and can therefore create downward pressure on bullion. A weaker dollar can have the opposite effect.
The latest recovery in gold has coincided with some easing in the dollar following the inflation data. If this weakness continues, it could provide additional support to XAU/USD. If the dollar returns to a strong upward trend, gold could face renewed resistance.
For Dubai's gold market, this relationship is particularly relevant because the UAE dirham maintains a close relationship with the US dollar. Consequently, international XAU/USD movements remain a major factor in determining AED-denominated gold values.
US Treasury Yields and Gold
Bond yields have become a major short-term driver of gold prices. When Treasury yields rise, investors may find interest-bearing securities more attractive compared with an asset that does not provide regular interest income.
Recent increases in Treasury yields contributed to the pressure on precious metals during the September correction. If yields continue to rise, gold may struggle to establish a strong recovery. Conversely, a sustained decline in yields could improve the environment for bullion.
Gold traders should therefore watch the 10-year Treasury yield alongside XAU/USD. A gold rally accompanied by falling yields can provide stronger macroeconomic confirmation than a gold rally occurring while yields are accelerating higher.
Oil Prices and Gold Fundamentals
Oil prices have also become an important factor for gold because energy prices directly affect inflation expectations. Higher oil prices can increase concerns about future inflation and can influence expectations for central-bank policy.
This creates a two-sided effect. Rising oil prices can increase demand for inflation protection, which can support gold. At the same time, higher energy inflation can encourage central banks to maintain restrictive monetary policy, which can pressure gold through higher interest rates and yields.
For this reason, traders should not analyse oil prices independently from interest-rate expectations. The effect on gold depends on how financial markets interpret the inflation and monetary-policy consequences of energy-price movements.
Geopolitical Risk and Safe-Haven Demand
Geopolitical uncertainty remains another fundamental component of the gold market. Gold can attract defensive demand when investors become concerned about conflicts, international trade disruptions, financial instability or other major risks.
However, safe-haven demand can fluctuate rapidly. A geopolitical headline may initially push gold higher, but the move can reverse if investors subsequently focus on interest rates, the dollar or Treasury yields.
For this reason, geopolitical risk should be considered alongside technical and macroeconomic factors rather than treated as a standalone signal.
Gold Market Outlook for Dubai
Dubai occupies a unique position in the international gold industry. The city's established bullion and jewellery ecosystem connects local buyers and sellers with international precious-metals markets.
For a Gold Trade in Dubai, monitoring global spot prices is essential, but local business conditions are equally important. Retail demand, jewellery purchases, bullion investment, inventory levels, customer preferences and local pricing spreads can influence commercial activity.
When international gold prices experience large movements, Dubai dealers may need to adjust quotations rapidly to manage inventory and pricing risk. The difference between international spot gold and the final price of a physical product can also vary according to purity, fabrication costs, dealer margins and product type.
The 24-karat gold market remains especially important for investors and bullion buyers because it provides a relatively direct connection to the international gold price. Jewellery buyers may also focus on 22K and other purity levels depending on their requirements.
Gold Trading Scenarios for 30 September 2026
Bullish Recovery Scenario
A bullish technical scenario would develop if gold maintains a position above 4,200 dollars and subsequently breaks through the 4,230 to 4,250 resistance area. A move toward 4,300 would then become technically significant.
This scenario would receive additional fundamental support if Treasury yields decline, the US dollar weakens and expectations for additional Federal Reserve rate increases decrease.
Bearish Continuation Scenario
A bearish scenario would develop if gold fails to maintain the current recovery and breaks below the 4,100 to 4,110 support zone. Such a move would indicate that sellers remain dominant after the September correction.
A sustained break below this region could place the 4,000-dollar psychological area back into focus. Traders should distinguish between a brief intraday break and a confirmed breakdown because volatile gold markets can produce false technical signals.
Sideways Consolidation Scenario
Gold may also remain inside a broad consolidation range if buyers and sellers continue to receive conflicting macroeconomic signals. In such a situation, prices could fluctuate between support and resistance without establishing a sustained direction.
This type of environment often produces multiple false breakouts, making confirmation particularly important for short-term traders.
Gold Technical and Fundamental Factors at a Glance
| Factor | Current Market Consideration | Importance for Gold |
|---|---|---|
| XAU/USD Price | Recovering around the 4,200-dollar region after a sharp correction | Determines the immediate technical structure |
| Major Support | 4,100 to 4,110 dollars | Important area for protecting the recent recovery |
| First Resistance | 4,200 to 4,210 dollars | Important short-term recovery test |
| Major Resistance | 4,230 to 4,250 dollars | Breakout area for stronger recovery momentum |
| Psychological Resistance | 4,300 dollars | Important round-number market level |
| Federal Reserve | Interest rates remain restrictive | Can influence yields, dollar strength and gold demand |
| US Inflation | Recent data provided some relief to gold | Influences future monetary-policy expectations |
| US Dollar | Recent weakness has supported bullion | Important inverse influence on XAU/USD |
| Treasury Yields | Elevated yields remain a market risk | Higher yields can increase gold's opportunity cost |
| Oil Prices | Energy prices remain relevant to inflation expectations | Can influence both inflation and interest-rate expectations |
| Geopolitical Risk | Continues to create potential safe-haven demand | Can produce sudden changes in investor positioning |
| Dubai Gold Market | Local prices remain closely connected to international bullion | Important for physical gold businesses and consumers |
What Dubai Gold Traders Should Monitor Next
Gold traders and businesses in Dubai should monitor five major areas as September ends and October begins.
- XAU/USD support and resistance: The reaction around 4,200 dollars and the ability to cross 4,230 to 4,250 dollars will provide important information about short-term market strength.
- US inflation: Additional inflation reports can quickly change expectations for Federal Reserve policy.
- US employment data: Labour-market figures can influence expectations for interest rates, the dollar and Treasury yields.
- Treasury yields and the US dollar: These remain critical confirmation indicators for gold's next major move.
- Dubai physical gold demand: Local jewellery and bullion demand can affect commercial pricing and inventory decisions.
Early October could therefore remain an active period for the gold market. Economic data and central-bank expectations may produce rapid movements, particularly because gold has already experienced a significant correction during September.
Gold Price Outlook: 30 September 2026
The gold market on 30 September 2026 is positioned at an important technical crossroads. The recent decline has weakened the short-term structure, but the recovery from the 4,100-dollar region shows that buyers remain willing to enter the market at lower prices.
The 4,200-dollar level is currently a key psychological reference. A sustained recovery above this area would improve the immediate technical picture, while a failure to hold the region could leave gold vulnerable to another test of recent lows.
The next major technical test is the 4,230 to 4,250-dollar zone. A successful break and sustained trading above this area would provide stronger evidence that the market is rebuilding upward momentum. Until that occurs, the recovery should be viewed as a developing technical rebound rather than a confirmed long-term trend reversal.
On the downside, the 4,100 to 4,110-dollar area remains important. A decisive breakdown could increase selling pressure and bring the 4,000-dollar psychological level into focus.
From a fundamental perspective, the direction of US interest-rate expectations remains central. Softer inflation, lower Treasury yields and a weaker dollar can support gold, while persistent inflation, higher yields and renewed dollar strength can create headwinds.
Conclusion
Gold's market on 30 September 2026 combines a significant technical correction with a rapidly changing fundamental environment. The recent decline demonstrated that gold remains sensitive to interest-rate expectations, Treasury yields and currency movements, while the subsequent rebound demonstrated continued demand near lower price levels.
For traders and gold businesses in Dubai, the most important technical areas are currently the 4,100 to 4,110-dollar support zone, the 4,200-dollar psychological level and the 4,230 to 4,250-dollar resistance region. The market's reaction around these levels can provide useful information about whether the current rebound is developing into a broader recovery or remaining a temporary correction within a larger decline.
Fundamentally, Federal Reserve policy, US inflation, Treasury yields, the US dollar, oil prices and geopolitical developments remain the major forces capable of changing gold-market sentiment. Local Dubai gold prices will continue to reflect international bullion conditions while also responding to physical-market factors.
For Gold Trade in Dubai, the current environment highlights the importance of combining technical analysis with fundamental market monitoring. Price levels alone cannot explain every gold-market movement, and fundamental news alone cannot identify every important trading zone. A combined approach provides a broader framework for understanding price behaviour and managing exposure during periods of elevated volatility.
This Gold Technical Analysis Report is provided for general market information and educational purposes. Gold prices can change rapidly, and technical levels are reference areas rather than guaranteed future prices. Traders, investors and businesses should evaluate current market conditions and their own risk management requirements before entering any transaction.
Frequently Asked Questions About Gold Technical Analysis
What is the key gold price level on 30 September 2026?
The 4,200-dollar area is an important short-term reference for XAU/USD. The market's ability to maintain prices above this area can influence near-term momentum.
What is the major support for gold?
The 4,100 to 4,110-dollar area is an important recent support zone. A sustained break below it could increase downside momentum.
What is the next important resistance for gold?
The 4,230 to 4,250-dollar region is an important recovery resistance area, followed by the psychological 4,300-dollar level.
Why does the Federal Reserve affect gold?
Federal Reserve interest-rate decisions influence Treasury yields and the US dollar. Higher yields can increase the opportunity cost of holding non-interest-bearing gold, while lower yields can make bullion relatively more attractive.
Why is the US dollar important for gold?
International gold is priced in US dollars. Changes in the dollar can affect the purchasing power of international buyers and therefore influence XAU/USD demand.
Why is gold important in Dubai?
Dubai has a major bullion and jewellery ecosystem. International gold prices have a direct influence on local gold values, while physical demand, product purity and commercial premiums also affect the final price of gold products.
Gold Trade in Dubai - Gold Market Analysis
Report: Gold Technical Analysis Report - 30 Sept 2026
Market: XAU/USD and Dubai Gold Market
Location: Dubai, United Arab Emirates
Topics: Gold Technical Analysis, Gold Price Dubai, Gold Trading Dubai, XAU/USD, Gold Fundamental Analysis, Gold Support and Resistance, Gold Market Outlook, Dubai Gold Rate, Gold Investment and Precious Metals.