
September 21, 2026
Market Report Date: 21 September 2026
Market: Gold and XAU/USD
Market Focus: Dubai, UAE
Gold enters the new trading week with investors watching an unusual combination of monetary tightening, currency strength, geopolitical uncertainty and persistent demand for precious metals. The international gold market is moving through an important technical area, while Dubai's physical gold market is also showing a modest decline in local prices at the beginning of the week.
For professional gold traders, bullion businesses, jewellery companies and investors in Dubai, the most important question is not simply whether gold rises or falls during one session. The larger issue is whether the current pullback develops into a deeper correction or becomes another opportunity for buyers to enter the market.
Gold Price Today: 21 September 2026
International spot gold was trading close to the $4,350 to $4,375 per ounce region on Monday. Market reporting placed spot gold near $4,371.95 per ounce during the session, while the metal remained below the recent high close to $4,400.
The movement reflects a market that is attempting to balance two opposing forces. A firm US dollar and expectations that US interest rates may remain restrictive are creating pressure on bullion. At the same time, geopolitical concerns and continued interest in gold as a reserve and defensive asset are helping limit the downside.
The result is a market where price action around important technical levels could become more significant than individual intraday movements.
Dubai Gold Rate Today
Dubai remains one of the world's most closely watched physical gold markets. On the morning of 21 September 2026, 24K gold was reported at approximately Dh525 per gram, compared with Dh527.50 per gram at the previous weekend close.
The reported Dubai rates were approximately Dh486 per gram for 22K gold, Dh466 for 21K gold and Dh399.50 for 18K gold during the morning update.
Local gold rates can change during the trading day because Dubai prices respond to movements in international bullion markets. Retail jewellery prices may also differ from the quoted metal rate because of workmanship, retailer margins and other commercial charges.
For Dubai gold companies, monitoring international XAU/USD alongside the local gram rate provides a more complete view of the market.
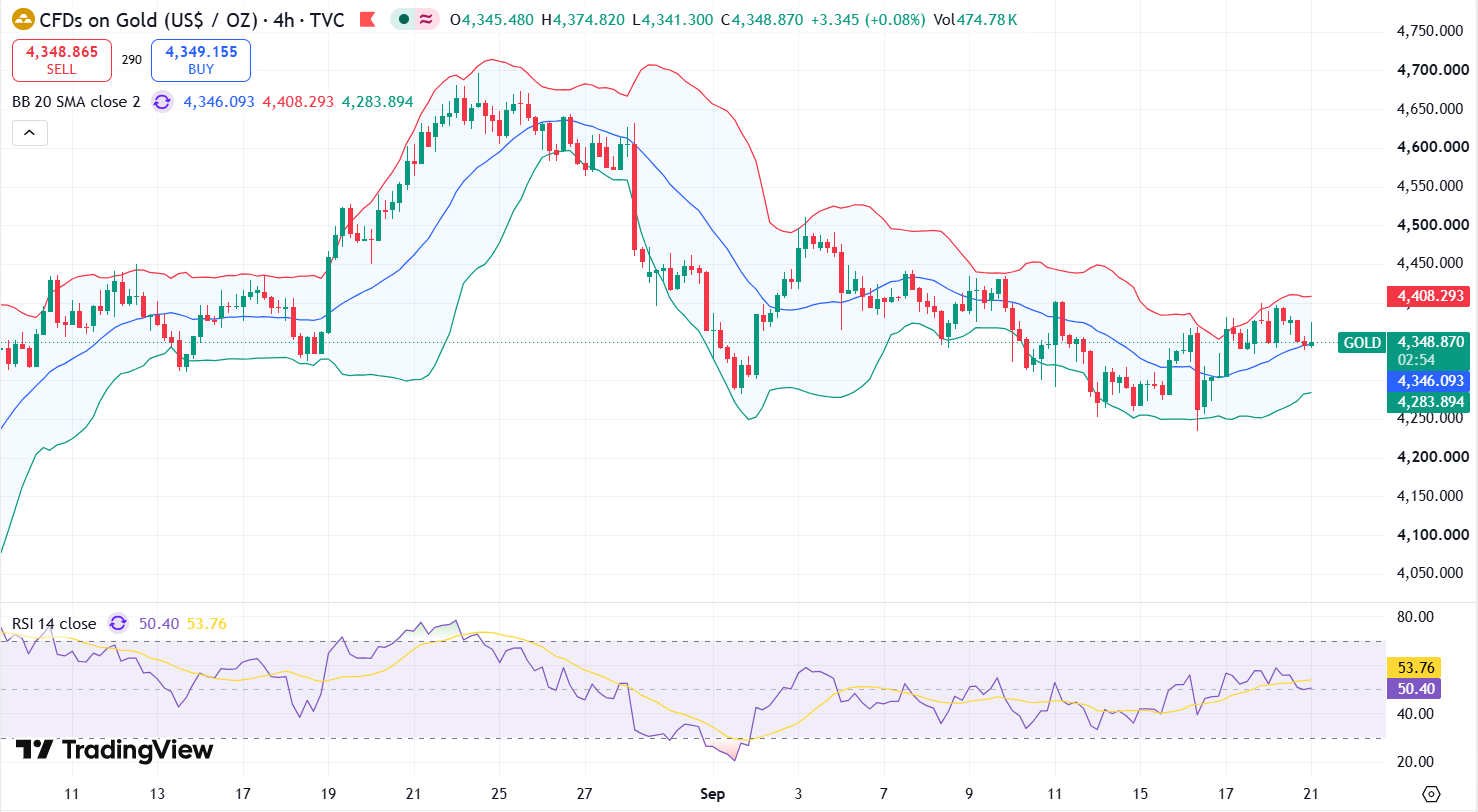
XAU/USD Technical Analysis for 21 September 2026
The short-term chart structure remains cautious. Gold has recovered from its recent decline but has encountered selling pressure as it approaches the $4,400 region. Momentum has not yet produced a decisive bullish breakout.
Current technical observations place the 20-day exponential moving average near $4,366.80. Gold has been trading around this indicator, making it an important short-term trend reference.
The Relative Strength Index is close to the middle of its range, around 49 in the latest technical assessment. Such a reading does not indicate an extreme overbought or oversold condition. Instead, it suggests that momentum is relatively balanced, with traders waiting for a stronger directional signal.
Important Gold Support Levels
- $4,350: Immediate area where buyers and sellers are currently competing.
- $4,300: Major psychological level that could become important during a deeper correction.
- $4,235: A significant recent swing-low region and a broader downside reference.
Important Gold Resistance Levels
- $4,367: Approximate 20-day EMA and an immediate technical hurdle.
- $4,380: Short-term resistance area identified by recent price action.
- $4,400: Major psychological and recent market resistance.
- $4,466 to $4,520: A higher resistance region if gold produces a confirmed breakout.
Why $4,350 Matters for Gold Traders
The $4,350 region is currently one of the most important short-term reference points for XAU/USD. Gold has repeatedly interacted with this area while traders assess the impact of interest rates, the dollar and geopolitical developments.
A sustained recovery above the nearby moving-average area could improve the short-term technical picture. However, repeated rejection around this zone would suggest that sellers remain active.
Traders should distinguish between a temporary intraday move and a confirmed technical break. Gold can briefly move above or below a support or resistance level before reversing. Confirmation through closing prices, momentum and broader market conditions can therefore be more useful than reacting to a single price spike.
$4,400 Gold Resistance in Focus
The $4,400 level has become an important psychological barrier after gold recently approached this price. The market reached a recent high close to $4,399 before pulling back.
A convincing move through $4,400 would place greater attention on higher technical zones. Traders would then assess whether the breakout has sufficient momentum to extend toward the mid-$4,400s and beyond.
On the other hand, repeated failure near $4,400 could encourage short-term profit-taking. In that situation, attention would likely return to $4,350 and subsequently the $4,300 region.
Federal Reserve Interest Rates and Gold
US monetary policy remains one of the most important fundamental drivers of gold prices. The Federal Reserve recently increased its target interest-rate range to 3.75 percent to 4.00 percent.
Higher interest rates can make yield-producing assets more attractive relative to non-yielding gold. This creates an opportunity-cost headwind for bullion and can also support the US dollar.
However, the relationship is not mechanical. Gold can continue to attract buyers even when interest rates are high if investors are concerned about geopolitical risks, financial uncertainty, currency diversification or long-term inflation.
Consequently, Dubai gold traders should consider the Federal Reserve's policy direction together with Treasury yields and the US dollar instead of using the interest-rate decision alone as a gold-price signal.
US Dollar Strength and Its Effect on XAU/USD
The US dollar remains an important influence on international gold prices because gold is quoted globally in dollars.
Recent market data placed the US Dollar Index around 100.30, close to its recent multi-week high. A stronger dollar can make gold more expensive for international buyers and can reduce the appeal of bullion in the short term.
For XAU/USD traders, the relationship between the dollar and gold is therefore worth monitoring closely. If the dollar continues strengthening while Treasury yields remain elevated, gold may face additional resistance.
Conversely, a decline in the dollar could provide room for gold to recover, particularly if geopolitical uncertainty remains elevated.
Geopolitical Risk Remains Relevant
Geopolitical developments continue to influence investor behaviour across currencies, commodities and precious metals.
Gold traditionally attracts defensive demand during periods when investors are concerned about military conflict, financial instability or disruptions to global energy markets. This factor is currently important because developments in the Middle East can affect both safe-haven demand and inflation expectations.
The relationship can work in different directions. A geopolitical escalation may increase demand for gold as a defensive asset. At the same time, if the event causes energy prices to rise sharply, investors may become concerned about inflation and further monetary tightening. That second effect can create pressure on bullion.
Oil Prices and Gold Market Sentiment
Crude oil has become another important variable for the gold market. Changes in energy prices influence inflation expectations, bond yields and central-bank policy expectations.
A sustained decline in oil prices could reduce concerns about an additional inflation shock. Lower inflation pressure may eventually allow bond yields to stabilize or fall, which can improve the environment for gold.
A sharp recovery in crude prices could produce the opposite effect if traders begin anticipating renewed inflation pressure and a more restrictive monetary-policy environment.
Central Bank Demand Provides Long-Term Support
Short-term traders tend to focus on price charts, economic releases and currency movements, but central-bank activity represents a different component of the gold market.
Official-sector purchases have remained an important feature of the global gold market in recent years. Central banks can use bullion as part of reserve diversification, which means their purchasing behaviour is not necessarily driven by the same short-term signals used by speculative traders.
This structural demand can provide an underlying source of interest even during periods when gold experiences temporary corrections.
Gold Technical Indicators to Watch
20-Day Exponential Moving Average
The 20-day EMA is currently close to $4,366.80. A sustained move above this indicator would improve the short-term chart structure, while continued rejection below it would keep the immediate momentum cautious.
Relative Strength Index
RSI near 49 indicates that momentum is relatively neutral. The indicator is not showing the type of extreme reading that normally accompanies a heavily overbought or oversold market.
Price Structure
Price structure remains more important than any single indicator. Traders should watch whether gold establishes higher highs and higher lows or instead begins creating lower highs below the $4,400 region.
Gold Market Scenarios for Dubai Traders
Upside Scenario
The bullish technical scenario would strengthen if XAU/USD establishes itself above the $4,400 area after overcoming nearby resistance. Such a move would show that buyers have absorbed recent selling pressure.
If a breakout occurs while the US dollar weakens and bond yields soften, the move would have additional macroeconomic support. Higher resistance areas could then become the next focus for traders.
Downside Scenario
The bearish scenario would become more relevant if gold fails to hold the $4,350 area and subsequently moves below $4,300.
A break beneath $4,300 could signal that the recent recovery has lost momentum. A stronger dollar, elevated Treasury yields and expectations of additional US monetary tightening could reinforce that pressure.
Range-Bound Scenario
Gold could also remain inside a broad trading range if neither buyers nor sellers gain sustained control. In this environment, the $4,300 to $4,400 area could remain the primary short-term reference range.
Gold Technical Levels for 21 September 2026
| Zone | Approximate Level | Technical Importance |
|---|---|---|
| Major resistance | $4,400 | Psychological barrier and recent high area |
| Resistance | $4,380 | Near-term selling zone |
| 20-day EMA | $4,366.80 | Short-term trend reference |
| Immediate support | $4,350 | Current market battleground |
| Major support | $4,300 | Important psychological level |
| Major swing support | $4,235 | Broader downside reference |
| Higher resistance | $4,466–$4,520 | Potential area after a confirmed upside breakout |
These figures are analytical reference points and should not be interpreted as guaranteed turning points. Gold can move rapidly through technical levels when major economic, geopolitical or monetary-policy developments occur.
What Dubai Gold Traders Should Monitor This Week
- Federal Reserve communication: Comments from US policymakers can alter expectations for future interest-rate decisions.
- US Treasury yields: Rising yields can increase pressure on non-yielding bullion, while falling yields can improve its relative attractiveness.
- US Dollar Index: Continued dollar strength could limit gold's recovery, while dollar weakness may provide additional support.
- Geopolitical developments: New developments in major conflict zones can produce rapid safe-haven flows into precious metals.
- Crude oil: Energy prices can influence inflation expectations and therefore the outlook for interest rates.
- Dubai gold rates: Local bullion prices should be monitored alongside international XAU/USD because Dubai rates can change as global gold prices move.
Gold Price Outlook for Dubai on 21 September 2026
The current gold market is characterized by competing forces rather than a single dominant driver. The Federal Reserve's restrictive stance and a firm US dollar are creating short-term resistance, while geopolitical uncertainty and structural interest in gold are helping to maintain underlying demand.
From a technical perspective, the $4,350 region deserves close attention. Holding above this area and recovering through the nearby 20-day EMA could improve the immediate structure. A move through $4,400 would represent a more significant bullish development.
In contrast, sustained trading below $4,350 would increase the importance of $4,300. A decisive break of that psychological level could expose lower technical zones, particularly if the US dollar and Treasury yields continue moving higher.
For Dubai's physical gold market, the international trend remains particularly relevant. With 24K gold around Dh525 per gram in the latest morning Dubai update, local traders are already seeing the effect of the recent international price adjustment.
Gold Trading in Dubai: What the Current Market Means
Dubai's gold industry includes bullion dealers, jewellery manufacturers, retailers, investors and international trading businesses. Each participant may respond differently to a change in gold prices.
A jewellery business may be more concerned with inventory replacement costs and customer demand, while a bullion trader may focus more closely on international spot prices, spreads, liquidity and short-term volatility.
This is why a professional gold market report should consider both the international XAU/USD chart and the local Dubai gold rate.
Frequently Asked Questions About Gold Technical Analysis
What is the gold price today on 21 September 2026?
International spot gold was trading around the $4,350 to $4,375 per ounce area on 21 September 2026, with reported spot pricing near $4,371.95 during the session. Prices can change continuously while international markets are open.
What is the Dubai gold rate today?
The morning Dubai update on 21 September 2026 placed 24K gold around Dh525 per gram, 22K around Dh486, 21K around Dh466 and 18K around Dh399.50 per gram. Local prices can change during the day.
What are the important gold support levels?
The $4,350 region is an immediate reference point, while $4,300 represents a major psychological support area. The recent $4,235 region is another important downside reference.
What is the major resistance level for XAU/USD?
The $4,400 area is currently an important psychological and technical resistance zone. A sustained move above that area would shift attention toward higher resistance levels.
Is gold bullish or bearish today?
The short-term picture is mixed. Gold is facing pressure from a firm US dollar and restrictive US monetary policy, while geopolitical uncertainty and continuing demand for bullion provide countervailing support. Traders should therefore evaluate the price structure around major support and resistance levels rather than relying on a single directional label.
Why does the US dollar affect gold prices?
Gold is internationally priced in US dollars. When the dollar strengthens, gold can become more expensive for buyers using other currencies. Dollar movements can therefore influence international demand and XAU/USD price action.
Conclusion
The Gold Technical Analysis Report for 21 September 2026 points to a market entering another important decision zone. XAU/USD remains close to the $4,350 area after failing to maintain a move toward $4,400, while the US dollar and Federal Reserve policy are providing important headwinds.
The immediate technical map is centered on $4,350 support, $4,300 major support and $4,400 resistance. A sustained break above resistance would change the short-term structure, while a decisive move beneath $4,300 would increase the possibility of a deeper correction.
In Dubai, the latest 24K gold rate of approximately Dh525 per gram demonstrates how international bullion movements are reflected in the local market.
The coming sessions could therefore be important for determining whether gold is entering another recovery phase or extending its recent correction. Gold traders should monitor XAU/USD price action, the US Dollar Index, Treasury yields, Federal Reserve commentary, geopolitical developments and Dubai's local gold rates together rather than relying on a single indicator.
Important: This report is provided for market-information and educational purposes. Technical levels are subject to change as new price data becomes available and should not be interpreted as a guarantee of future gold prices or as individualized financial advice.