
September 11, 2026
XAU/USD Faces Fresh Downside Pressure Ahead of US CPI
Gold Technical Analysis Report – 11 September 2026 | XAU/USD Outlook | Dubai Gold Market | Gold Price Forecast
Gold prices are under renewed pressure on Friday, September 11, 2026, as rising US Treasury yields, a stronger dollar and increasing expectations of tighter Federal Reserve policy weigh on the precious metal. Spot gold is trading around the $4,325–$4,340 per troy ounce area, after another volatile week that has pushed the market toward an important technical support zone.
Spot gold was around $4,324.79 an ounce on September 11, up approximately 0.2% during the session but still on course for a third consecutive weekly decline of more than 2%. US gold futures for December delivery were around $4,364.70.
For traders and bullion buyers in Dubai, today's market is particularly important because gold is approaching a technical decision area while global investors await the latest US Consumer Price Index data and the Federal Reserve's September policy meeting.
This Gold Technical Analysis Report for September 11, 2026 examines the latest XAU/USD price action, major support and resistance levels, momentum, Federal Reserve expectations, US yields, the US dollar, geopolitical risk and the implications for the Dubai gold market.
Market note: Technical analysis identifies potential scenarios rather than guaranteed outcomes. This report is for market information and educational purposes and should not be interpreted as personalized financial advice.
Gold Price Today: XAU/USD Market Overview
The immediate picture for gold has changed considerably from the bullish momentum seen earlier in the year.
Gold has recently fallen from the upper levels of its September trading range, with sellers gaining control as expectations of a Federal Reserve rate increase have strengthened. On September 7, spot gold at approximately $4,410.55 per ounce, following stronger US employment data that lifted expectations for a September Fed hike.
By September 11, spot gold had moved toward approximately $4,325, representing a substantial short-term correction.
The market is now caught between two opposing forces.
On one side, higher US interest-rate expectations and Treasury yields are bearish for gold because bullion does not generate interest income. When bond yields rise, the opportunity cost of holding non-yielding gold increases.
On the other side, persistent geopolitical uncertainty, central-bank accumulation and concerns surrounding global inflation continue to provide a structural source of demand.
This conflict is producing unusually important technical levels for traders.
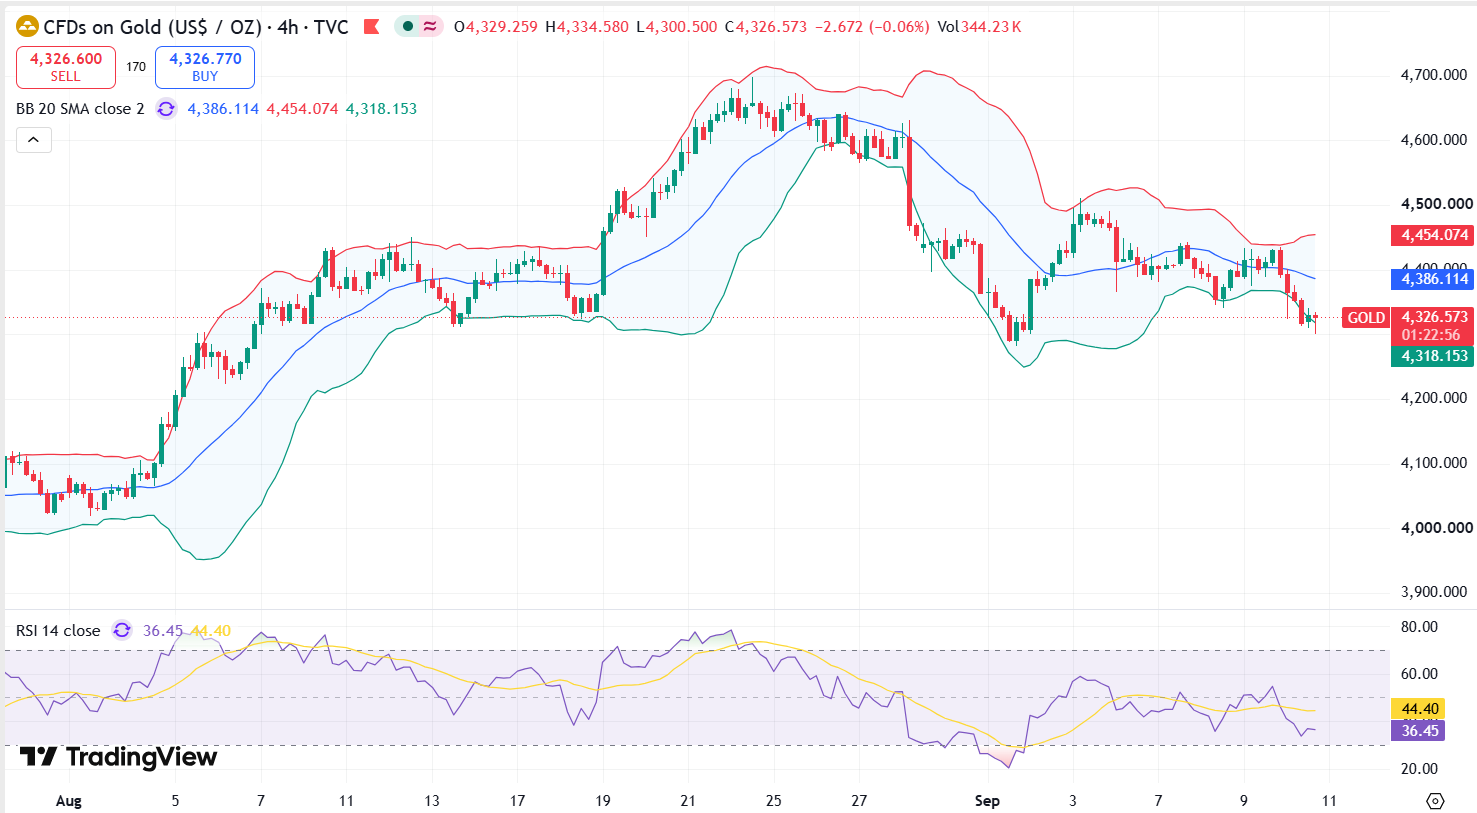
Gold Technical Analysis September 11, 2026
From a short-term technical perspective, the XAU/USD trend is currently bearish to neutral, with the price trading below several important resistance zones.
The most important development is that gold has moved toward the $4,300–$4,320 region, which is increasingly becoming a key test for buyers.
Recent technical analysis identifies resistance around $4,448, followed by the $4,507–$4,537 region, while downside levels include approximately $4,305–$4,319, $4,230 and $4,165.
This creates a relatively clear technical framework.
Key Gold Support Levels
- $4,320–$4,300: Immediate and psychologically important support.
- $4,305–$4,319: Technical support area highlighted by recent market analysis.
- $4,250–$4,230: Secondary downside support if $4,300 fails.
- $4,165: Deeper support and potential longer-term correction area.
The $4,300 level deserves particular attention because it combines psychological importance with recent price-action support.
A decisive daily close below this zone could encourage additional liquidation and expose the next downside levels.
However, traders should distinguish between an intraday move below support and a confirmed technical breakdown. A temporary dip below $4,300 followed by a rapid recovery could represent a false breakdown rather than the beginning of a larger bearish trend.
Gold Resistance Levels to Watch
The recovery side of the market also has clearly defined barriers.
The first important resistance area is approximately $4,400–$4,450. Gold would need to regain this region to demonstrate that sellers are losing their immediate control.
Above that, the next major resistance area is approximately $4,500–$4,540.
Gold Trade identifies $4,448 as resistance and $4,507–$4,537 as a key resistance zone.
Therefore, the technical map for September 11 can be summarized as follows:
| Technical Zone | XAU/USD Level | Market Significance |
|---|---|---|
| Major Resistance | $4,500–$4,540 | Bullish breakout zone |
| First Resistance | $4,400–$4,450 | Recovery confirmation area |
| Current Decision Area | $4,300–$4,340 | Key buyer/seller battle |
| First Major Support | $4,230–$4,250 | Next downside objective |
| Deeper Support | Around $4,165 | Larger correction zone |
These levels should be treated as zones rather than exact prices because gold can experience substantial intraday volatility during US economic releases.
Why Is Gold Falling Today?
The biggest immediate driver is the changing outlook for US monetary policy.
The Federal Reserve's September 15–16 meeting is approaching, and recent economic data have caused traders to reassess the possibility of higher interest rates.
On September 9 that a majority of economists surveyed expected the Fed to leave rates unchanged at its September meeting and through the end of 2026, but the probability of at least one rate increase has been increasing. Markets were pricing a greater possibility of rate hikes into early 2027 as inflation and energy prices remained elevated.
That is a significant change for gold.
Gold generally benefits when real yields fall, the US dollar weakens and expectations for monetary easing increase. The opposite environment can create pressure.
The latest US Producer Price Index data have added to that pressure. August producer prices increased 0.4%, encouraging speculation that inflation could remain persistent and potentially require a more restrictive Federal Reserve policy.
The next major catalyst is the US CPI report.
US CPI Could Trigger the Next Major Gold Move
The September 11 US inflation release is arguably the most important short-term catalyst for XAU/USD.
A softer-than-expected CPI reading could reduce expectations for additional Federal Reserve tightening. That would potentially weaken the US dollar and Treasury yields, creating room for gold to rebound.
A hotter-than-expected CPI reading would have the opposite effect.
Higher inflation could reinforce expectations that interest rates need to remain elevated, pushing yields and the dollar higher while creating another headwind for gold.
For this reason, gold traders should expect potentially sharp price swings around the US inflation release.
The market is no longer trading solely on technical indicators. Macroeconomic data are capable of invalidating a technical setup within minutes.
US Treasury Yields: A Major Gold Market Risk
The US bond market is currently one of the most important variables for gold.
The 10-year Treasury yield recently approached the psychologically significant 5% level, while rising oil prices and inflation concerns contributed to the bond-market selloff. The 10-year yield climbed to approximately 4.96%, close to its highest level in nearly three years.
For gold investors, this matters because rising yields increase the relative attractiveness of interest-bearing assets.
If Treasury yields continue rising, gold may struggle to establish a sustained recovery above $4,400.
Conversely, if yields reverse sharply following softer inflation data, gold could experience a powerful relief rally.
US Dollar and Gold Correlation
The US dollar is another important factor for today's gold outlook.
Gold is internationally priced in US dollars. When the dollar strengthens, gold can become more expensive for holders of other currencies, potentially reducing demand.
Recent market conditions have favored the dollar because of higher yield expectations.
The combination of:
- stronger US yields,
- higher inflation expectations,
- increased Federal Reserve rate-hike speculation, and
- relatively firm dollar demand
has created a difficult environment for gold bulls.
However, this relationship is not permanent. Any substantial reversal in yields or dollar momentum could quickly change the technical structure.
Geopolitical Risk Remains a Bullish Gold Factor
Despite the current bearish technical setup, gold retains an important safe-haven support mechanism.
Geopolitical tensions in the Middle East are contributing to higher energy prices and uncertainty across financial markets. Renewed tensions involving the Iran-aligned Houthis and Yemen were among the factors affecting market expectations, while oil prices moved sharply higher.
This creates a complicated situation.
Higher oil prices can increase inflation expectations, which may hurt gold through higher interest-rate expectations. But geopolitical escalation can simultaneously increase demand for gold as a safe-haven asset.
Therefore, geopolitical headlines could produce two-way volatility rather than a simple bullish or bearish response.
Central Bank Gold Buying Provides Long-Term Support
The short-term technical picture should not obscure the longer-term structural story.
Central banks continue to represent a major source of gold demand.
Central banks have accumulated an average of approximately 1,000 tonnes of gold annually over the past four years, highlighting the importance of official-sector demand to the modern gold market.
Recent reporting on July purchases showed continued accumulation by several central banks. China added approximately 20 tonnes in July, while Poland added around 8 tonnes and continued to rank among the strongest buyers in 2026.
This underlying demand provides an important counterweight to short-term speculative selling.
It also helps explain why gold can remain structurally supported even when the Federal Reserve outlook becomes temporarily more hawkish.
Dubai Gold Market Outlook for September 11, 2026
Dubai remains one of the world's most important physical gold trading centers, and international XAU/USD movements are closely watched by bullion dealers, investors, jewellery buyers and traders throughout the UAE.
Current published Dubai gold-rate data show that local prices have also moved lower with the international market. A September 11 Dubai gold-rate listing showed a decline from the previous session, while UAE gold-price references also reflected the day's softer international pricing.
The important point for Dubai buyers is that the local retail price is influenced by several variables, including:
- international spot gold prices;
- the USD/AED exchange relationship;
- gold purity;
- local market premiums;
- dealer margins;
- jewellery-making charges, where applicable; and
- VAT and other transaction considerations.
The UAE dirham's close relationship with the US dollar means that movements in XAU/USD generally translate efficiently into local gold pricing.
For Dubai gold traders, therefore, $4,300 and $4,400 are particularly important global reference points when assessing the likely direction of local bullion rates.
Bullish Gold Scenario
The bullish scenario requires evidence that buyers are successfully defending the $4,300 area.
If gold forms a strong rejection from approximately $4,300–$4,320 and subsequently moves back above $4,400, the short-term bearish structure would begin to weaken.
A sustained move through $4,450 would strengthen the recovery case.
Above that, traders would focus on $4,500–$4,540.
A decisive breakout and daily acceptance above that resistance region could reopen the path toward higher September levels and signal that the recent correction is losing momentum.
The bullish sequence would therefore be:
$4,300 support → $4,400 recovery → $4,450 breakout → $4,500–$4,540 confirmation.
This scenario would become more credible if US inflation data came in softer than expected and Treasury yields moved lower.
Bearish Gold Scenario
The bearish scenario becomes stronger if gold cannot defend $4,300.
A confirmed daily breakdown below $4,300 could expose the $4,250–$4,230 region.
If that area also fails, the next significant downside reference could move toward approximately $4,165.
Technical analysts have recently highlighted the $4,320 area as an important threshold, with a sustained move below nearby support potentially exposing $4,300 and $4,250.
The bearish sequence would therefore be:
Failure below $4,300 → $4,250 → $4,230 → $4,165.
A hotter US CPI reading accompanied by rising Treasury yields would strengthen this scenario.
Gold Technical Indicators: What Traders Should Watch
Beyond headline price levels, traders should monitor momentum and trend confirmation.
The 50-day moving average remains a useful medium-term reference. Current technical data place the XAU/USD 50-day moving average near $4,386, meaning gold is trading below that indicator and the short-term technical structure remains under pressure.
The Relative Strength Index should also be monitored.
If RSI approaches oversold territory while gold tests $4,300, the probability of a technical rebound may increase. However, oversold conditions alone do not guarantee a bottom. Strong bearish trends can remain oversold for extended periods.
Volume and price reaction are therefore more important than a single indicator.
For professional traders, the ideal confirmation would be a combination of:
- support rejection;
- improving momentum;
- recovery above short-term resistance;
- falling Treasury yields; and
- a weaker US dollar.
Gold Forecast for the Next Few Trading Sessions
The short-term outlook for gold is best described as cautiously bearish below $4,400, with $4,300 acting as the major decision point.
As long as XAU/USD remains below the $4,400–$4,450 resistance region, rallies may continue to attract sellers.
However, a sustained defense of $4,300 could create the foundation for a relief rally.
The market's next major direction is likely to be determined by three interconnected factors:
- US CPI inflation data
- Federal Reserve interest-rate expectations
- US Treasury yields and the dollar
Geopolitical developments and central-bank demand remain important secondary forces.
What Does This Mean for Gold Traders in Dubai?
For a Dubai-based gold trading business, the current market calls for a disciplined approach rather than reacting to every intraday move.
Physical bullion buyers may view sharp corrections differently from short-term XAU/USD traders. Jewellery businesses, wholesalers, investors and active traders all have different time horizons and risk requirements.
The most important lesson from today's market is that gold's long-term structural strength does not eliminate short-term downside risk.
Gold can remain a strategically important asset while simultaneously experiencing a significant technical correction.
For Dubai traders monitoring the market today, $4,300 is the central technical level to watch. Holding this area could encourage a rebound toward $4,400 and eventually $4,450. A sustained breakdown below $4,300 would instead increase the probability of a move toward $4,250 and $4,230.
Gold Technical Analysis Report – Key Takeaways
Gold enters September 11, 2026 under short-term pressure, with spot prices around the $4,325 area and the market heading toward a potentially decisive inflation-driven session. Gold remained on track for a third consecutive weekly decline, while higher inflation expectations and rising yields have strengthened the case for tighter US monetary policy.
The key technical picture is:
- Current XAU/USD area: approximately $4,325–$4,340.
- Immediate support: $4,300–$4,320.
- Next downside support: $4,230–$4,250.
- Major deeper support: around $4,165.
- First resistance: $4,400–$4,450.
- Major resistance: $4,500–$4,540.
- Short-term bias: bearish below $4,400.
- Bullish confirmation: sustained recovery above $4,450 and especially $4,500.
- Bearish confirmation: sustained breakdown below $4,300.
- Major fundamental catalyst: US CPI and Federal Reserve expectations.
- Long-term support: central-bank gold accumulation and geopolitical uncertainty.
The next major move in gold is unlikely to be determined by technical charts alone. The interaction between inflation, interest rates, Treasury yields, the US dollar and geopolitical risk will determine whether buyers defend the $4,300 region or sellers push the market into a deeper correction.
For Dubai's gold market, international XAU/USD direction remains a critical benchmark. Traders, investors and bullion buyers should therefore monitor both the global spot market and local UAE gold rates before making transaction decisions.
Gold remains a market of opportunity, but September 11 is a session where confirmation matters more than prediction.
What is the gold price outlook for September 11, 2026?
Gold has a cautious short-term outlook, with the market trading near the $4,300–$4,340 area. A sustained break below $4,300 could expose lower support, while a recovery above $4,400 would improve the short-term outlook.
What are the key support levels for gold today?
The primary support area is around $4,300–$4,320, followed by approximately $4,230–$4,250. A deeper technical support level is around $4,165.
What are the main resistance levels for XAU/USD?
The first major resistance area is approximately $4,400–$4,450, followed by the $4,500–$4,540 zone.
Why is gold under pressure today?
Higher US Treasury yields, stronger expectations of Federal Reserve tightening and inflation concerns are creating short-term pressure on gold. The upcoming US CPI release is an important potential catalyst.
Is gold still supported by central-bank demand?
Yes. Central banks continue to accumulate gold at historically significant levels. The World Gold Council says central banks have averaged roughly 1,000 tonnes of annual gold accumulation over the past four years.
What should Dubai gold traders watch today?
Dubai traders should closely monitor international XAU/USD, US CPI, Federal Reserve expectations, US Treasury yields, the US dollar and local UAE gold rates. These factors can materially influence bullion prices in Dubai.