
September 11, 2026
XAG/USD Outlook, Support, Resistance and Dubai Silver Market
Silver Technical Analysis Report – 11 September 2026 | XAG/USD Price Outlook | Silver Price Dubai | Silver Trading Forecast
Silver prices are attempting to stabilize on Friday, September 11, 2026, after a sharp decline earlier in the week. Spot silver is trading around $63.93 per troy ounce, according to the latest market report, with the metal gaining approximately 0.6% during Friday's session while remaining more than 3% lower for the week.
The latest price action leaves silver at an important technical crossroads.
The precious metal has experienced substantial volatility throughout 2026, with repeated rallies failing to establish a sustainable recovery. Technical analysis published earlier this month highlighted $62.54 and $56.54 as important support areas, while $71.54 remains a significant upside reference. A decisive break below the July low around $54.74 could expose substantially lower technical targets.
For traders, investors, bullion dealers and precious-metals businesses in Dubai, the current setup is particularly significant because silver sits between two powerful forces: a challenging interest-rate environment on one side and long-term industrial demand on the other.
This Silver Technical Analysis Report for September 11, 2026 examines the latest XAG/USD price action, support and resistance levels, Federal Reserve expectations, US inflation, Treasury yields, the US dollar, industrial demand, geopolitical risks and the outlook for silver prices in Dubai.
Important: Technical analysis identifies potential market scenarios and does not guarantee future price movements. This article is intended for market information and educational purposes and should not be considered individualized investment advice.
Silver Price Today: XAG/USD Market Overview
Silver is trading close to $64 per ounce as the market enters the final part of the week.
The current price represents a considerable retreat from the higher levels seen during previous rallies. Gold Trade reported that silver climbed to approximately $67.90 on September 9, gaining 3.3% as the US dollar weakened and investors prepared for important inflation data.
That recovery, however, was short-lived.
On September 10, silver suffered a sharp 4.6% decline to $64.19, as stronger inflation-related concerns increased expectations of a Federal Reserve rate hike.
By September 11, silver had recovered modestly to approximately $63.93, but remained more than 3% lower on the week.
This sequence illustrates the current character of the silver market: large intraday moves, failed recoveries and significant sensitivity to interest-rate expectations.
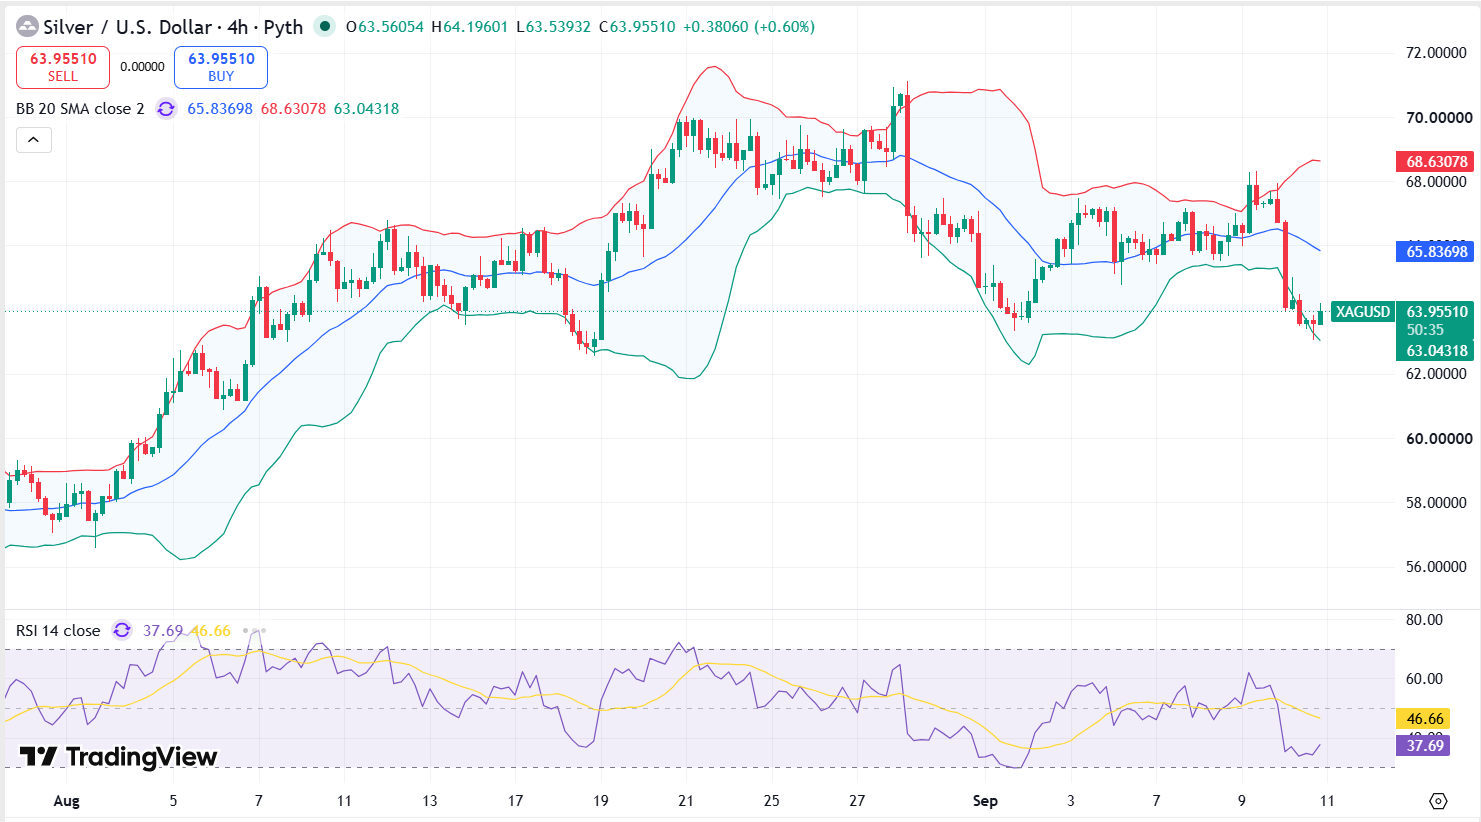
Silver Technical Analysis September 11, 2026
The short-term technical structure remains fragile.
Silver is trading close to the $62.54–$64.00 support region, an area that could determine whether the current correction develops into another major downward leg or becomes the foundation for a technical rebound.
$62.54 is an important support level and $56.54 is another major support zone. Also $71.54 is an important previous high that bulls would need to challenge again.
The technical map therefore gives traders several critical levels.
Key Silver Support Levels
- $63–$62.54: Immediate technical decision zone.
- $56.54: Major secondary support.
- $54.74: July swing low and crucial bearish/bullish boundary.
- $48.60: Potential downside objective if $54.74 fails.
- $45.51: Deeper technical target in an extended bearish scenario.
These levels should be regarded as zones rather than precise points because silver is highly volatile and can move several dollars within a relatively short period.
A sustained recovery above $64 would be constructive, but it would not by itself establish a bullish reversal.
The market needs to reclaim higher resistance areas before the broader technical structure can be considered meaningfully improved.
Silver Resistance Levels to Watch
The first challenge for silver bulls is the area around $67–$68, corresponding closely with the recent September rebound zone.
Above that, the market faces the more important $70–$72 region.
The $71.54 level is particularly important because it represents the June 17 high. Reclaiming this level would demonstrate that buyers are capable of overcoming one of the market's major previous barriers.
Beyond $72, the broader $70–$80 zone remains heavily contested.
Gold Trade noted that a sustained breakout through the $70–$80 area would be needed to open the way toward the May high around $89.36.
The principal resistance framework can therefore be summarized as:
| Technical Zone | Silver Price <.th> | Significance |
|---|---|---|
| Immediate Resistance | $67–$68 | First recovery test |
| Major Resistance | $70–$72 | Key breakout area |
| Broad Resistance Zone | $70–$80 | Heavy historical supply |
| Major Upside Target | Around $89.36 | Previous May high |
| Immediate Support | $62.54 | Current technical decision zone |
| Secondary Support | $56.54 | Major downside defense |
| Critical Support | $54.74 | July low |
| Extended Downside | $48.60 | Bearish scenario |
| Deeper Downside | $45.51 | Extended correction |
Why Is Silver Falling in September 2026?
The biggest immediate issue is the changing outlook for US monetary policy.
Silver, unlike gold, has both monetary and industrial characteristics. This makes it especially sensitive to changes in global economic expectations.
When investors anticipate higher interest rates, the US dollar and Treasury yields can rise. This tends to create pressure on precious metals priced in dollars.
The latest US economic developments have intensified that pressure.
The US Producer Price Index increased 0.4% in August, after an upwardly revised 0.1% gain in July. The stronger producer-price data increased market expectations for a Federal Reserve rate increase at the September 15–16 meeting.
The market is now focused heavily on the US Consumer Price Index.
US CPI: The Biggest Silver Catalyst on September 11
The August US CPI report is one of the most important events for silver traders today.
Economists expected headline CPI to increase approximately 0.4% month-on-month and 3.4% year-on-year, while core CPI was forecast at approximately 0.2% month-on-month and 2.4% year-on-year.
A stronger-than-expected inflation report could increase expectations for Federal Reserve tightening.
That could push Treasury yields and the US dollar higher, creating another headwind for silver.
A softer inflation reading could have the opposite effect.
Lower inflation expectations could reduce pressure on yields, weaken the dollar and encourage investors to rebuild exposure to precious metals.
This means silver traders should be prepared for potentially extreme volatility around the inflation release.
Federal Reserve Rate Decision and Silver
The Federal Reserve's September 15–16 meeting is now a central focus for precious-metals markets.
Financial markets were pricing approximately a 72% probability of a 25-basis-point Fed hike on September 11, up from about 49% one week earlier.
This is a major change in expectations.
Higher interest rates can negatively affect silver because they increase the opportunity cost associated with holding precious metals.
The relationship is particularly important when higher rates are accompanied by a stronger US dollar and rising real yields.
However, the relationship between rates and silver is not always straightforward.
Silver's substantial industrial demand means that expectations for economic growth can also influence prices. If the market interprets higher rates as evidence of persistent economic strength, industrial silver demand could provide some support.
If higher rates instead raise fears of a global economic slowdown, the industrial component of silver demand becomes a potential source of downside pressure.
US Treasury Yields Are a Major Risk for Silver
The bond market is currently sending an important signal.
On September 11 that the US 10-year Treasury yield had climbed to approximately 4.97%, approaching the psychologically significant 5% level. The move has been driven by inflation concerns, higher oil prices, geopolitical uncertainty and expectations of tighter monetary policy.
This is significant for silver.
Precious metals generally become less attractive when safe government bonds offer increasingly high yields.
If the 10-year Treasury yield moves decisively above 5%, silver could experience additional pressure, particularly if the US dollar simultaneously strengthens.
On the other hand, a sharp reversal in Treasury yields following weaker inflation data could create a powerful short-term rebound in silver.
US Dollar Outlook and Silver
The US dollar remains one of the most important variables for XAG/USD.
Silver is denominated in US dollars, meaning that dollar appreciation can make silver more expensive for international buyers.
During September, the dollar has been moving in response to changing Federal Reserve expectations.
When the dollar weakened earlier in the week, silver benefited. Silver rose to around $67.91 on September 9 as the dollar remained near a two-week low.
The following session demonstrated how quickly the relationship can reverse.
As inflation concerns pushed yields and rate expectations higher, silver fell sharply.
For silver traders, the combination of DXY direction + US Treasury yields + Fed expectations remains one of the most important short-term signals.
Silver's Unique Advantage: Industrial Demand
Silver is different from gold because a significant portion of global silver consumption comes from industrial applications.
The metal is used in areas including:
- solar photovoltaic technology;
- electronics;
- electrical components;
- automotive applications;
- medical technology;
- industrial equipment;
- telecommunications; and
- various high-tech manufacturing processes.
This creates an additional long-term demand argument for silver.
Unlike gold, which is predominantly driven by investment, jewellery, central-bank and monetary demand, silver can benefit when industrial production and technological investment expand.
This dual identity is one reason silver can outperform gold during strong precious-metals bull markets—but it is also why silver can experience greater downside when economic growth expectations deteriorate.
Silver's High Volatility Creates Both Risk and Opportunity
Silver is historically more volatile than gold.
This characteristic is clearly visible in the current market.
A 4.6% single-session decline in silver on September 10, followed by a modest recovery on September 11.
This type of price movement is important for traders in Dubai because physical silver transactions and leveraged XAG/USD positions have very different risk profiles.
For active traders, volatility creates opportunities but also increases the importance of position sizing and stop-loss discipline.
For physical buyers, sudden declines can create attractive entry points, but buyers should consider premiums, purity, dealer spreads and transaction costs rather than focusing exclusively on the international spot price.
Silver and the Gold-Silver Relationship
Another useful indicator is the gold-silver ratio.
The ratio measures how many ounces of silver are equivalent in value to one ounce of gold.
When the ratio rises significantly, silver is relatively inexpensive compared with gold. When it falls, silver is relatively expensive compared with gold.
For professional precious-metals traders, this ratio can provide useful context for assessing whether silver is underperforming or outperforming gold.
The current environment is particularly interesting because both metals are experiencing pressure from rising yields and changing Fed expectations, but silver's industrial exposure creates additional economic sensitivity.
This means silver can diverge significantly from gold even when both metals respond to the same macroeconomic headline.
Silver Technical Indicators to Watch
Price levels remain the most important part of the current chart, but traders should also monitor momentum indicators.
The Relative Strength Index (RSI) can help determine whether the recent decline is becoming technically oversold.
However, traders should not automatically interpret an oversold RSI as a buy signal.
Silver has demonstrated that it can remain under pressure for extended periods when the broader trend is bearish.
Moving averages should also be monitored.
If silver remains below important short- and medium-term moving averages, rallies may continue to encounter selling pressure.
A stronger technical reversal would ideally include:
- a higher low;
- a break above short-term resistance;
- improving RSI momentum;
- rising trading volume;
- a weaker US dollar; and
- falling Treasury yields.
The more of these signals appear simultaneously, the stronger the case for a sustainable recovery.
Bullish Silver Scenario for September 2026
The bullish scenario begins with silver successfully defending the $62.54 area.
If buyers absorb selling pressure around $62.54 and push XAG/USD back above $64–$65, the first recovery target could be the $67–$68 region.
A sustained move above $68 would improve the technical structure.
The major confirmation would come if silver retakes $70–$72, particularly the $71.54 previous high.
A decisive breakout above this region would suggest that the sequence of lower recovery highs is finally changing.
The longer-term bullish path could then target the upper part of the $70–$80 range and potentially the previous $89.36 high.
The bullish sequence can therefore be summarized as:
$62.54 defense → $65 recovery → $68 breakout → $71.54 reclaim → $80+ continuation potential.
A softer-than-expected US CPI report, falling Treasury yields and a weaker dollar would strengthen this scenario.
Bearish Silver Scenario
The bearish scenario becomes more concerning if silver loses $62.54 on a sustained basis.
The next major technical area would be around $56.54.
If that level fails, the market could retest the July low near $54.74.
A decisive break below $54.74 would significantly damage the medium-term structure and could expose approximately $48.60, followed by $45.51, based on the technical levels highlighted.
The bearish sequence would therefore be:
$62.54 failure → $56.54 → $54.74 → $48.60 → $45.51.
This scenario becomes more likely if US CPI is stronger than expected, Treasury yields rise above 5%, the dollar strengthens and markets increase expectations for additional Fed tightening.
Silver Price Forecast for the Next Few Sessions
The immediate outlook for silver should be considered neutral-to-bearish below $68–$70, with $62.54 acting as the crucial near-term support.
The market is currently too close to major support to confidently assume that another major selloff is inevitable.
At the same time, there is not yet enough evidence to declare that a durable bullish reversal has begun.
The most important question is therefore not whether silver will rise or fall on a particular day.
The more useful question is:
Can silver defend $62.54 and begin establishing higher lows?
If yes, the market could begin another attempt toward $68 and $71.54.
If no, attention will shift toward $56.54 and potentially $54.74.
Silver Market Outlook for Dubai
Dubai is one of the world's major precious-metals trading centers, making international silver prices particularly relevant for local dealers, investors and bullion businesses.
The international XAG/USD price is a crucial benchmark for physical silver pricing in the UAE.
However, the final price paid by a customer in Dubai can differ from the international spot price because of several factors, including:
- silver purity;
- physical form;
- dealer premium;
- fabrication or manufacturing costs;
- wholesale versus retail pricing;
- transaction size;
- currency considerations; and
- applicable taxes and charges.
For this reason, customers should distinguish between international silver spot price and the final Dubai retail or wholesale silver rate.
A sharp move in XAG/USD can nevertheless have an immediate influence on local silver-market sentiment.
What Dubai Silver Traders Should Watch Today
For September 11, Dubai silver traders should monitor five major signals.
1. XAG/USD Around $62.54
This is arguably the most important technical reference for the immediate market.
A strong defense would favor a rebound scenario.
2. US CPI
The inflation report can rapidly change interest-rate expectations and therefore silver's short-term direction.
3. US 10-Year Treasury Yield
A move toward or through 5% would represent a significant headwind for precious metals.
4. US Dollar
A weaker dollar would generally be supportive for dollar-denominated silver.
5. Oil and Geopolitical Risk
Oil prices have risen dramatically amid Middle East tensions, increasing inflation concerns. Reuters reported Brent crude near $110 per barrel on September 11.
Higher oil prices create a complicated environment for silver because they can support inflation expectations while simultaneously increasing the risk of higher interest rates.
Silver Price Outlook: September 11, 2026
The current silver market can be summarized through three potential scenarios.
| Scenario | Key Level | Potential Market Direction |
|---|---|---|
| Bullish | Above $68–$72 | Recovery strengthens |
| Neutral | $62.54–$68 | Consolidation and volatility |
| Bearish | Below $62.54 | $56.54 and $54.74 become vulnerable |
| Extended Bearish | Below $54.74 | $48.60 and $45.51 become possible technical targets |
These are analytical scenarios, not guaranteed price targets.
Silver Versus Gold: Which Metal Has Greater Potential?
Investors often compare silver with gold, but the two metals behave differently.
Gold is primarily a monetary and investment asset, while silver has both monetary and industrial characteristics.
Gold generally attracts stronger safe-haven demand during periods of financial stress.
Silver, meanwhile, can deliver larger percentage gains during strong precious-metals cycles because its market is smaller and more sensitive to shifts in industrial and investment demand.
The trade-off is volatility.
Silver's recent 4.6% one-day decline illustrates the additional risk investors must accept.
For Dubai precious-metals traders, the appropriate choice therefore depends on the objective, holding period, liquidity requirement and tolerance for price fluctuations.
Silver Technical Analysis Report – Key Takeaways
Silver enters September 11, 2026 after a highly volatile week.
The latest market data put spot silver at approximately $63.93 per ounce, up 0.6% on the day but still more than 3% lower for the week.
The central technical level is $62.54.
Holding this level could provide the foundation for a recovery toward $67–$68 and potentially $71.54.
A sustained break below $62.54 would increase the risk of a move toward $56.54 and $54.74.
Below $54.74, the longer-term technical targets identified in recent analysis include approximately $48.60 and $45.51.
The major upside challenge remains the $70–$80 resistance zone.
A decisive breakout above this area could reopen the path toward the previous May high around $89.36.
Fundamentally, silver remains caught between two opposing forces.
The bearish side includes:
- higher US Treasury yields;
- increased Federal Reserve rate-hike expectations;
- a potentially stronger US dollar;
- inflation-related monetary tightening; and
- concerns about industrial demand if global economic growth weakens.
The bullish side includes:
- silver's industrial applications;
- potential long-term technological demand;
- geopolitical uncertainty;
- potential dollar weakness;
- lower future interest rates if inflation eventually moderates; and
- the possibility of a technical rebound from major support.
For the Dubai silver market, the immediate message is clear: $62.54 is the level to watch.
A successful defense could create an attractive technical recovery setup, while a confirmed breakdown would warn of a deeper correction.
The next major directional catalyst is the US inflation report and its impact on Federal Reserve expectations.
For silver traders and bullion buyers in Dubai, September 11 is therefore less about predicting one exact price and more about watching how price behaves around critical support and resistance.
Silver remains a high-volatility precious metal with both industrial and monetary demand drivers. The market's next major move will depend on whether buyers can defend the current support structure or whether macroeconomic pressure forces another leg lower.
What is the silver price today on September 11, 2026?
Spot silver was reported around $63.93 per ounce on September 11, 2026, with the metal rising approximately 0.6% during the session while remaining more than 3% lower for the week.
What are the key silver support levels today?
The most important near-term support is around $62.54, followed by $56.54 and the July low near $54.74.
What are the important resistance levels for XAG/USD?
Silver faces initial resistance around $67–$68, while $70–$72 is a much more important technical area. The $71.54 level represents a significant previous high.
Why is silver under pressure in September 2026?
Silver has been pressured by rising US Treasury yields, stronger expectations for Federal Reserve tightening and concerns about inflation. The metal also remains sensitive to expectations for industrial demand.
Could silver fall below $60?
Yes. If the $62.54 support level fails decisively, the technical structure could expose $56.54 and then the July low near $54.74.
Could silver return above $70?
A recovery above $70 is technically possible if silver successfully defends current support and macroeconomic conditions become more favorable. A sustained break through the $70–$80 zone would be more significant for the medium-term bullish outlook.
What affects silver prices in Dubai?
Dubai silver prices are influenced by international XAG/USD prices, the US dollar, global interest rates, industrial demand, physical-market premiums, silver purity, transaction size and local market conditions.
Is silver more volatile than gold?
Silver generally exhibits greater price volatility than gold because it combines precious-metal investment demand with substantial industrial demand. The 4.6% one-day decline reported on September 10 illustrates the scale of short-term moves that can occur in the silver market.
Disclaimer
This report is an original market-analysis article prepared using current publicly reported market information available on September 11, 2026. Prices can change rapidly after publication. Technical levels are analytical reference points rather than guaranteed targets, and readers should verify live market prices before making trading or purchasing decisions.