
September 14, 2026
Published: 14 September 2026
Market: Gold / XAU/USD
Location Focus: Dubai, UAE
Report Type: Gold Technical Analysis & Market Outlook
Prepared for: Gold Trade, Dubai
Gold enters the new trading week under renewed selling pressure as investors reassess the outlook for U.S. interest rates, inflation and global energy prices. On 14 September 2026, spot gold fell to around $4,296.68 per troy ounce, representing a decline of approximately 1.2% on the day, while U.S. gold futures also weakened. The move places the precious metal back around a technically important $4,300 area at a time when markets are preparing for the Federal Reserve's September policy decision.
For Dubai gold traders, dealers and investors, today's market is particularly important because international XAU/USD movements feed directly into local gold pricing. Gold Trade's Dubai market data currently shows international gold around the $4,300-per-ounce region, while Dubai retail gold rates remain substantially influenced by the global spot price, the U.S. dollar and local market premiums.
The immediate technical picture has become more cautious. Gold is struggling to regain the $4,400 region after several weeks of corrective price action, while the $4,300-$4,280 zone has emerged as a major technical battleground. A sustained break beneath this area could expose gold to deeper downside levels, whereas a strong recovery above $4,400-$4,450 would begin to improve the short-term structure.
Gold Price Today: 14 September 2026
Gold began the week with significant volatility. Spot gold declined to approximately $4,296.68 per ounce, while December U.S. gold futures fell to about $4,335.40. The decline came as expectations for a Federal Reserve rate increase strengthened sharply.
Market pricing showed traders assigning roughly an 89% probability to a rate increase at the upcoming Fed meeting, compared with approximately 67% one week earlier.
Another important market reference is the recent September low. On 10 September, spot gold fell to approximately $4,355.85, with an intraday low around $4,323.78 after stronger U.S. inflation data increased expectations for tighter monetary policy.
The latest decline therefore means that gold is once again testing an area that traders have been watching closely.
For Dubai buyers and sellers, however, it is important to distinguish between international spot gold and the local Dubai gold rate. The price of finished jewellery can include workmanship, dealer margins and other market-specific costs.
Why Is Gold Falling Today?
The latest gold decline is being driven by a combination of monetary-policy expectations, the U.S. dollar, Treasury yields and energy-market inflation.
1. Federal Reserve Rate-Hike Expectations
The biggest short-term catalyst is the upcoming Federal Reserve meeting scheduled for 15-16 September.
Gold is a non-yielding asset. When market interest rates and bond yields rise, the opportunity cost of holding gold generally increases because investors can obtain higher returns from interest-bearing assets.
Current market expectations have shifted substantially toward a rate increase. Traders were pricing an approximately 89% probability of a Fed hike, while other market reports have put expectations close to 90%.
That repricing has placed additional pressure on XAU/USD.
2. Higher U.S. Treasury Yields
Treasury yields have become another major headwind for gold.
The U.S. 10-year Treasury yield recently approached the psychologically important 5% level, reaching approximately 4.9915% before retreating toward 4.95%. The move represents the highest level in nearly three years and reflects increasing inflation concerns.
Higher yields can make gold less attractive relative to government bonds, particularly when investors expect interest rates to remain elevated.
3. Stronger U.S. Dollar
The U.S. dollar has also strengthened.
The dollar index gained close to 0.4% on 14 September as geopolitical tensions and inflation concerns encouraged investors to seek safety in the U.S. currency.
Because gold is primarily priced in U.S. dollars, a stronger dollar can create additional downward pressure on dollar-denominated gold.
4. Rising Oil Prices and Inflation Concerns
The relationship between oil and gold is unusually important in the current environment.
Brent crude has moved above $108 per barrel amid heightened Middle East tensions and disruptions affecting important energy and shipping routes. Higher energy prices create renewed inflation concerns, increasing the possibility that central banks may maintain restrictive monetary policies for longer.
Geopolitical tension normally supports safe-haven demand for bullion. However, if the same geopolitical events cause oil prices to surge and inflation expectations to rise, the resulting increase in interest-rate expectations can temporarily outweigh gold's safe-haven appeal.
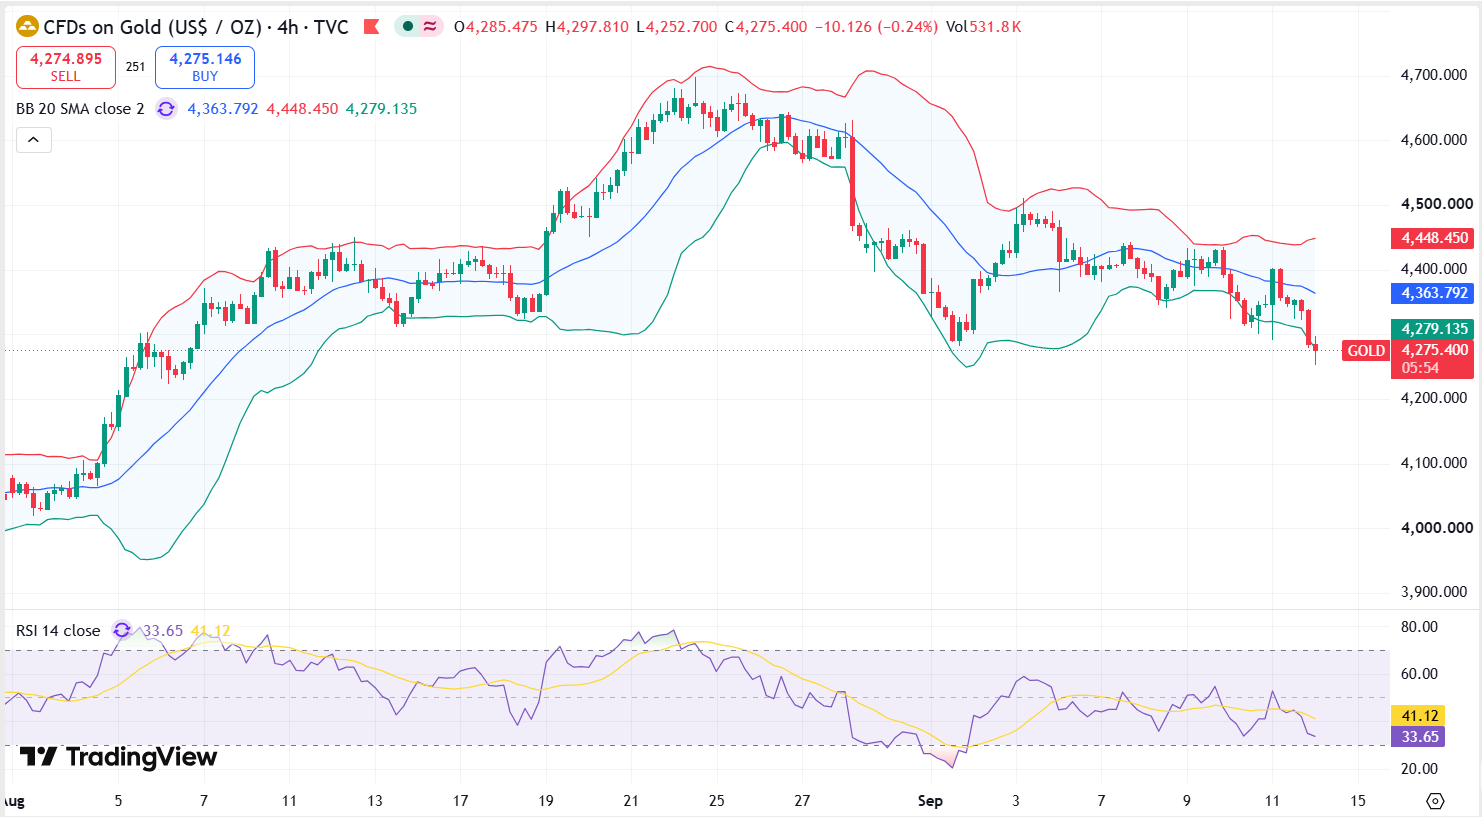
XAU/USD Technical Analysis for 14 September 2026
From a technical perspective, gold's short-term structure has weakened.
The key question for traders today is straightforward:
Can XAU/USD defend the $4,300-$4,280 support zone?
Recent market analysis has identified the $4,300 area as a critical level. Technical commentary earlier in September also highlighted the $4,300-$4,280 region as an important support zone, with a sustained break potentially activating a bearish head-and-shoulders structure.
Gold has now returned directly to this decision zone.
Key Gold Support Levels
- $4,300
- This is the first major psychological and technical support level. A recovery from $4,300 could encourage short-term bargain buying.
- $4,280
- A break below this level would make the bearish technical structure more convincing. Traders may then begin looking for lower support areas.
- $4,250
- This is an important secondary downside reference if sellers successfully establish control below $4,280-$4,300.
- $4,100-$4,000
- This represents a much deeper potential retracement area and should not be interpreted as an immediate price target. It becomes relevant only if the current corrective structure develops into a larger decline.
Key Gold Resistance Levels
- $4,350-$4,400
- This is the first recovery zone. Gold needs to regain this region to demonstrate that buyers are returning with meaningful strength.
- $4,400-$4,450
- This is a major resistance area. Previous technical analysis has repeatedly identified $4,400 as an important ceiling.
- $4,460
- A decisive daily close above approximately $4,460 would weaken the immediate bearish scenario and improve the possibility of a broader recovery.
- $4,500
- A sustained move above $4,500 would significantly improve the medium-term technical picture and bring higher resistance zones back into focus.
Gold Technical Outlook: Bullish vs Bearish Scenarios
Bearish Scenario
The bearish case remains the stronger short-term scenario while gold trades below the $4,400-$4,460 resistance band.
A decisive daily close below $4,300 would be an important technical warning. If $4,280 also fails to hold, sellers could attempt to push XAU/USD toward $4,250 and subsequently lower support areas.
The risk of further selling is particularly relevant because the market is entering a major Federal Reserve event window. A hawkish Fed statement, stronger-than-expected rate guidance or continued increases in Treasury yields could reinforce the dollar and weigh on gold.
However, traders should be cautious about chasing a decline after a sharp sell-off. Gold can experience rapid countertrend rallies, particularly when geopolitical risk remains elevated.
Bullish Scenario
The bullish scenario begins with a successful defense of $4,300-$4,280.
If buyers absorb selling pressure and push XAU/USD back above $4,350, the next challenge would be the $4,400 region.
A sustained move through $4,400 could open the door toward $4,450-$4,460. A daily close above $4,460 would provide stronger evidence that the recent decline may be evolving into a correction rather than the beginning of a deeper bearish trend.
Above $4,500, the technical outlook would become considerably more constructive.
The key point for Dubai gold traders is that $4,300 is currently the battlefield between buyers and sellers.
Moving Averages and Market Momentum
The recent price action indicates that gold's short-term momentum has deteriorated from the strong bullish conditions seen earlier in the year.
Technical analysis published earlier this month noted that XAU/USD remained capped below its 200-day simple moving average and that the market structure was showing characteristics of a bearish head-and-shoulders formation.
Other technical commentary has highlighted that gold's momentum indicators had already moved toward oversold conditions during the earlier September sell-off. This creates an important distinction for traders:
Oversold does not automatically mean bullish.
An oversold market can remain oversold while prices continue declining.
Therefore, technical traders should focus less on predicting an exact bottom and more on observing confirmation from price action.
- A bullish reversal candle around $4,300 would strengthen the rebound argument.
- A failed breakdown below $4,300 followed by a quick recovery could represent a bear trap.
- A daily close below $4,280 would strengthen the bearish continuation scenario.
- A recovery above $4,400 would indicate improving short-term momentum.
- A sustained break above $4,460 would materially weaken the immediate bearish setup.
What the Fed Means for Gold This Week
The Federal Reserve decision is likely to dominate gold trading through the middle of the week.
Markets are entering the meeting with unusually strong expectations for tighter policy. At the same time, geopolitical developments are pushing energy prices higher, creating a difficult inflationary environment for central banks.
For gold, the reaction may depend not simply on whether the Fed raises rates, but on what the central bank communicates about future policy.
If the Fed delivers a rate increase but signals that additional tightening may be limited, gold could potentially recover as traders sell the dollar and Treasury yields retreat.
Conversely, if policymakers emphasize persistent inflation, elevated energy prices and the need for further restrictive policy, gold could face another wave of selling.
This is why the Federal Reserve event creates elevated two-way risk for XAU/USD.
Dubai Gold Market Outlook
Dubai remains one of the world's major gold trading and jewellery hubs, making international gold-price movements especially relevant for local businesses and consumers.
For Dubai traders, the global gold price should be monitored alongside the local AED gold rate.
The UAE dirham is effectively pegged to the U.S. dollar, which means changes in international XAU/USD prices generally have a direct influence on the AED-denominated wholesale value of gold. However, retail jewellery prices can differ because of workmanship, product premiums, dealer spreads and other costs.
Gold Price Forecast for the Rest of 14 September 2026
The intraday outlook is best described as bearish-to-neutral, with $4,300 acting as the key pivot.
If gold remains below $4,350 and sellers maintain control, the market may retest $4,300. A decisive breakdown could expose $4,280 and potentially $4,250.
If $4,300 attracts strong buying interest, however, a corrective rebound toward $4,350-$4,400 is possible.
The market is likely to remain highly sensitive to changes in U.S. dollar strength, Treasury yields, crude oil prices and expectations surrounding the Federal Reserve.
Therefore, traders should expect volatility rather than assume that gold will move smoothly in one direction.
Gold Trading Strategy: What Should Traders Watch?
For short-term traders, the most important principle today is confirmation.
Instead of treating every move around $4,300 as a confirmed breakout or reversal, traders can monitor how price behaves after testing the level.
A Bearish Setup Becomes More Convincing When:
- Gold breaks below $4,300.
- Price remains below the level instead of quickly recovering.
- $4,300 turns from support into resistance.
- The dollar and Treasury yields continue rising.
- XAU/USD subsequently breaks below $4,280.
A Bullish Setup Becomes More Convincing When:
- Gold holds $4,300-$4,280.
- Sellers fail to sustain a breakdown.
- XAU/USD reclaims $4,350.
- Gold breaks above $4,400.
- A daily close develops above $4,460.
This approach avoids relying on a single indicator and instead combines price structure with macroeconomic confirmation.
Gold Trade Dubai: Key Takeaways for 14 September 2026
The gold market is entering one of its most important weeks of September.
The immediate technical picture is under pressure, with spot gold trading around the $4,300 region after falling approximately 1.2% on 14 September.
| Gold Level | Technical Significance |
|---|---|
| $4,500 | Major psychological resistance |
| $4,460 | Important bullish confirmation level |
| $4,400 | Major recovery resistance |
| $4,350 | First short-term resistance |
| $4,300 | Critical support / market pivot |
| $4,280 | Important bearish breakdown level |
| $4,250 | Next downside reference |
| $4,100-$4,000 | Deeper support zone if selling accelerates |
The immediate bias remains cautious-to-bearish below $4,400-$4,460, while the $4,300-$4,280 area represents the most important downside defense.
At the same time, gold's safe-haven role should not be ignored. Escalating geopolitical tensions are supporting demand for defensive assets, even as higher oil prices and inflation expectations are simultaneously increasing pressure on interest rates.
That conflict between safe-haven demand and higher-rate pressure is likely to remain the defining feature of gold trading during the week ahead.
Conclusion: Gold Technical Analysis 14 September 2026
Gold's technical structure has weakened as XAU/USD returns toward the crucial $4,300 area. Rising Federal Reserve rate-hike expectations, higher U.S. Treasury yields, a stronger dollar and elevated oil prices are currently creating a difficult environment for the precious metal.
Nevertheless, the $4,300-$4,280 zone could become an important decision area. If buyers successfully defend it, gold could attempt a recovery toward $4,350 and $4,400. A stronger move above $4,400-$4,460 would significantly improve the technical outlook.
On the other hand, a sustained daily close below $4,280 would strengthen the bearish scenario and expose the market to additional downside.
For Dubai gold traders, investors, jewellery businesses and bullion buyers, the next few sessions deserve close attention because international gold volatility is likely to translate into further changes in local UAE gold rates.
Gold Trade recommends monitoring XAU/USD, the U.S. dollar, Treasury yields, crude oil and the Federal Reserve decision together, rather than relying on the gold price alone.
Important Disclaimer
This report is provided for market information and educational purposes only. It is not financial, investment or trading advice. Gold prices can change rapidly, and technical levels can fail during major economic or geopolitical events. Investors and traders should conduct their own research and consider their individual financial circumstances before making any transaction.