
September 10, 2026
Gold Technical Analysis Report - 10 Sept 2026
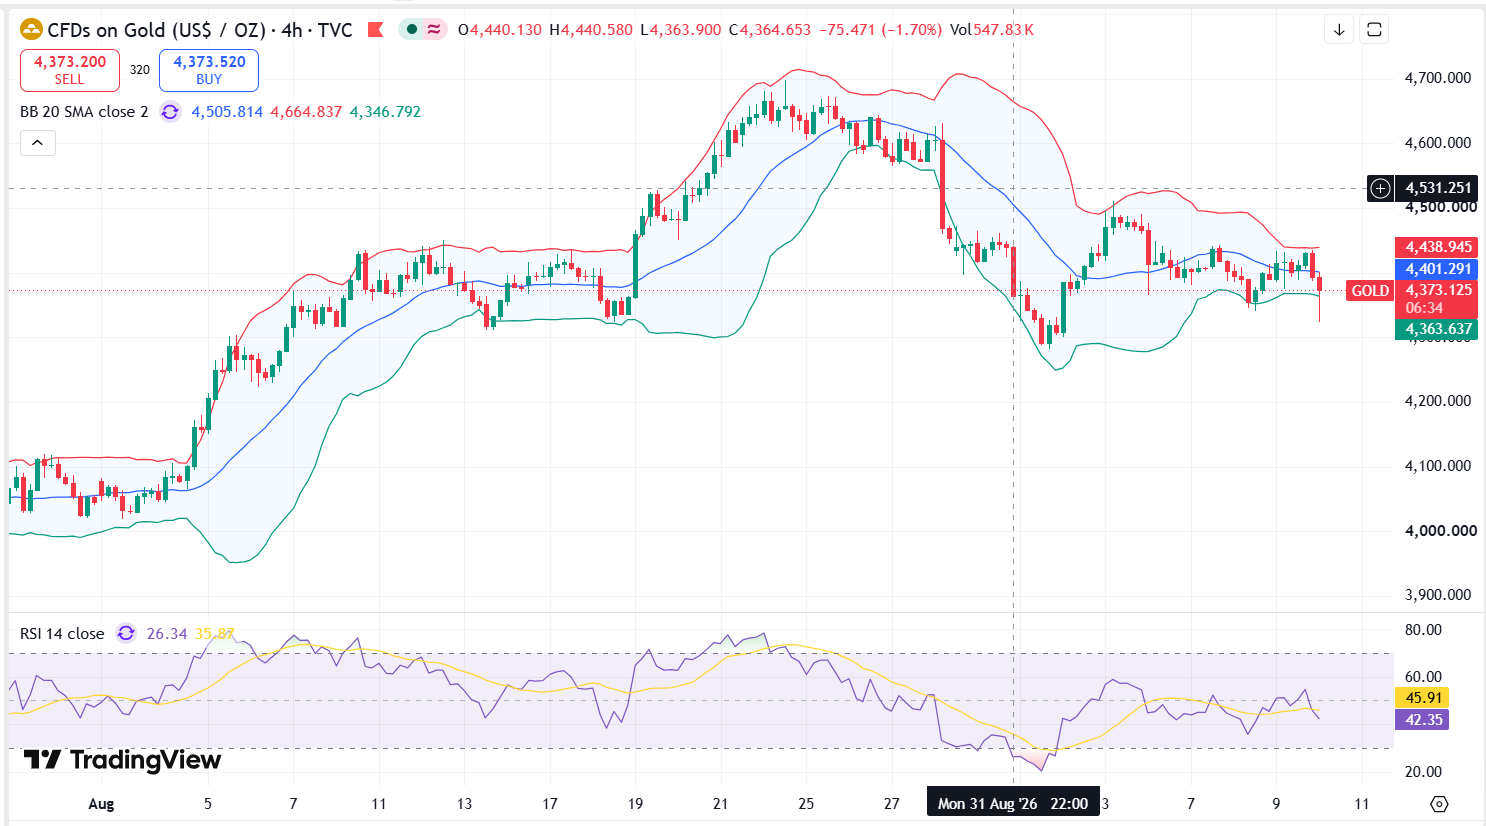
Dubai, UAE — September 10, 2026 — Spot gold (XAU/USD) experienced heightened intraday volatility on Thursday, 10 September 2026, opening at about $4,400.00 per troy ounce before surging to an intraday high of $4,435.00. Subsequent profit-taking and US dollar firming dragged prices down to a test of intraweek support at $4,324.00. As of writing, bullion has recovered partially, trading near $4,373.00 per ounce.
The current market dynamic reflects a tug-of-war between short-term rate expectations driven by upcoming US inflation metrics and sustained structural demand for physical gold across global hubs, particularly in Dubai. This report from Gold Trade, Dubai’s premier precious metals insight center, breaks down the intraday price action, key indicator setups, Fibonacci retracements, fundamental drivers, and strategic trading scenarios for market participants.
Executive Summary & Intraday Market Performance
| Metric | Level (USD / oz) | Market Assessment |
|---|---|---|
| Opening Price | $4,400.00 | Neutral start near key psychological barrier. |
| Intraday High | $4,435.00 | Resistance capped near top of descending channel. |
| Intraday Low | $4,324.00 | Strong buy-side liquidity defense near $4,320 zone. |
| Current Spot Price | $4,373.00 | Mid-range consolidation post-rebound. |
| Intraday Volatility Range | $111.00 | High intraday swing offering active trading opportunities. |
The $111 trading range highlights significant institutional participation at key technical boundaries. While the initial attempt to reclaim $4,435 failed to secure momentum, the sharp rejection from the $4,324 trough indicates that dip-buyers remain active near major medium-term support zones.
Technical Indicator Analysis & Chart Patterns
Moving Average Structures (EMAs)
On the 4-hour (H4) chart, XAU/USD is navigating a delicate technical balance relative to its Exponential Moving Averages:
- 20-Period EMA ($4,385.50): Gold is currently trading slightly below its short-term 20 EMA. A hourly close above $4,385 is required to shift short-term momentum from neutral-bearish back to intraday bullish.
- 50-Period EMA ($4,408.00): Represents a significant overhead barrier. Confluenced with today's opening level, this zone acts as immediate dynamic resistance.
- 200-Period EMA ($4,332.00): The 200 EMA served as the primary structural cushion during today's dip to $4,324. The bounce above $4,332 confirms that the broader multi-month structural uptrend remains technically intact despite short-term pullbacks.
Oscillators and Momentum Indicators
- Relative Strength Index (RSI - 14): Sitting at 44.20 on the 4-hour chart, the RSI resides in neutral territory, having rebounded from an oversold condition of 31.50 logged during the drop to $4,324. The indicator suggests room for expansion in either direction depending on news catalysts.
- MACD (12, 26, 9): The Moving Average Convergence Divergence histogram remains slightly below the zero signal line, reflecting ongoing corrective pressure. However, the convergence of the fast line toward the signal line hints at potential bullish cross formation if prices stabilize above $4,380.
- Stochastic Oscillator: Exhibiting a bullish hook from the oversold region below 20, pointing toward temporary recovery toward the $4,395–$4,410 corridor.
Key Support, Resistance, and Pivot Point Matrix
To guide physical bullion investors and derivatives traders, Gold Trade has calculated today's floor and ceiling levels using classic floor pivot mathematics based on today's high ($4,435.00), low ($4,324.00), and current spot level ($4,373.00).
| Technical Level Type | Price Level (USD) | Technical Significance |
|---|---|---|
| Resistance 3 (R3) | $4,541.70 | Major target for secondary bullish expansion. |
| Resistance 2 (R2) | $4,488.30 | Upper channel boundary and late August swing high. |
| Resistance 1 (R1) | $4,430.70 | Near today's high ($4,435); immediate supply zone. |
| Pivot Point (P) | $4,377.30 | Intraday equilibrium level; key decision zone. |
| Support 1 (S1) | $4,319.70 | Primary demand zone near today's low ($4,324). |
| Support 2 (S2) | $4,266.30 | Secondary structural support level. |
| Support 3 (S3) | $4,208.70 | Deep value zone and major trendline anchor. |
Fibonacci Retracement Breakdown
Analyzing today's swing high of $4,435.00 down to the trough of $4,324.00 yields key retracement targets for intraday recovery waves:
- 23.6% Retracement ($4,350.20): Reclaimed by buyers during the afternoon session, forming local minor support.
- 38.2% Retracement ($4,366.40): Current immediate line of defense. Holding above $4,366 preserves recovery momentum.
- 50.0% Retracement ($4,379.50): Direct overhead target aligned closely with the daily Pivot Point ($4,377.30).
- 61.8% Retracement ($4,392.60): The "Golden Ratio" level. A sustained hourly break above $4,392.60 would signal a complete technical reversal of today's drop, opening the path back to $4,435.
Fundamental Market Drivers Influencing XAU/USD
1. Federal Reserve Interest Rate Expectations & Economic Data
The primary macro catalyst driving gold price action this week is market anticipation surrounding upcoming US Producer Price Index (PPI) and Consumer Price Index (CPI) reports. With the Federal Open Market Committee (FOMC) meeting on the horizon, traders are pricing in probabilities for interest rate trajectory. Because non-yielding bullion incurs an opportunity cost when yields rise, hawkish rate bets limit immediate upside, whereas soft inflation figures trigger sharp buying spikes.
2. US Dollar Index (DXY) & Yield Correlation
Spot gold's drop to $4,324 coincided with a brief strengthening of the US Dollar Index toward 104.50 alongside modest upticks in 10-year US Treasury yields. However, as the dollar index surrendered its intraday gains during European trading hours, gold found floor support and retraced back to $4,373.
3. Institutional Central Bank Accumulation
Despite short-term paper market volatility, structural underlying demand remains exceptionally firm. Official central bank reserve filings show sustained net purchases of physical gold bullion by emerging market central banks, including the People's Bank of China (PBoC) and Middle Eastern sovereign institutions, utilizing price dips below $4,350 to accumulate long-term reserves.
Dubai Gold Market Perspective: Local Demand & Premium Analysis
As the global hub for gold trading, Dubai's physical market provides unique ground-level insights into bullion movements. At Gold Trade in Dubai, we observe distinct local dynamics that complement international spot price action:
- AED Peg Stability: Because the United Arab Emirates Dirham (AED) is pegged to the US Dollar at 3.674, local UAE gold bar prices directly reflect global spot price fluctuations without foreign currency distortions.
- Physical Souk & Wholesale Activity: The drop to $4,324 ($510 per gram for 24K equivalent) sparked renewed physical buying interest across the Dubai Gold Souk and DMCC vaulting networks. Retail jewellery buyers and institutional bullion stackers viewed the drop under $4,350 as an advantageous entry point.
- Physical Premiums: Local physical premiums over international spot have widened slightly to +$1.50 to +$2.20 per ounce, signaling robust regional physical demand in the GCC market despite speculative paper selling in western session futures markets.
Actionable Trading Scenarios & Strategy Matrix for Gold Trade Clients
Based on technical setup and fundamental conditions on 10 September 2026, Gold Trade presents three structured trading scenarios:
[ $4,435 Resistance / R1 ]- Scenario A: Bullish Break
- Trigger: Sustained close > $4,435
- Targets: $4,488 -> $4,540
- Stop Loss: $4,390 - Scenario B: Bearish Breakdown
- Trigger: Breakdown < $4,324
- Targets: $4,266 -> $4,208
- Stop Loss: $4,360 - Scenario C: Range Consolidation
Range: $4,324 to $4,435
Strategy: Buy near S1, Sell near R1
Scenario Breakdown Table
| Trading Scenario | Primary Entry Trigger | Target 1 (TP1) | Target 2 (TP2) | Stop-Loss (SL) | Risk / Reward Ratio |
|---|---|---|---|---|---|
| Bullish Breakout | 4H close above $4,435 | $4,488.00 | $4,540.00 | $4,395.00 | 1 : 2.5 |
| Bearish Continuation | 4H close below $4,324 | $4,266.00 | $4,208.00 | $4,360.00 | 1 : 2.2 |
| Range Trading (Buy) | Re-test of $4,330–$4,340 | $4,380.00 | $4,420.00 | $4,310.00 | 1 : 3.0 |
Conclusion & Strategic Outlook from Gold Trade
Spot gold’s price action on 10 September 2026 demonstrates clear resilience following an energetic $111 intraday range. While short-term technical indicators signal consolidation around $4,373, the defense of the $4,324 low underscores underlying structural strength.
For short-term margin traders, maintaining disciplined stop-loss management around the $4,324 support and $4,435 resistance barriers remains essential. For long-term investors and physical bullion clients in Dubai, periodic dips toward key EMA support levels present strategic dollar-cost averaging opportunities.
Gold Trade continues to provide institutional-grade vaulting, physical bullion trading, and daily technical research. Stay tuned to our market portal for real-time updates and live price quotes throughout the trading week.
Disclaimer: This technical analysis report is published for informational and educational purposes only by Gold Trade and does not constitute financial advice or direct market solicitation. Commodity trading carries risk of financial loss.
« Back to News & Reports List