
September 24, 2026
Gold Technical Analysis Report – 24 September 2026: Gold prices are facing renewed selling pressure on Thursday as higher US Treasury yields, a stronger US dollar and expectations for additional Federal Reserve rate increases weigh on the precious metal.
For Dubai's gold market, the latest available local data show 24K gold at around AED 517 per gram, while international spot gold price is trading in the region of $4,300–$4,320 per troy ounce during the latest intraday observations.
The technical picture has weakened compared with the middle of September. Momentum indicators and moving averages are currently pointing toward downside pressure, although the market is approaching important support areas where buyers could attempt to stabilize prices.
Technical analysis should therefore be interpreted alongside Federal Reserve policy, US dollar movements, Treasury yields, oil prices and geopolitical developments.
For businesses involved in gold trade in Dubai, these developments are particularly relevant because international XAU/USD movements are an important underlying driver of local bullion prices.
Dubai Gold Price Today – 24 September 2026
According to historical gold-rate data provided by the Dubai Gold & Jewellery Group and reported by Gulf News, Dubai's indicative rates on 24 September 2026 were approximately:
| Gold Purity | Dubai Gold Rate per Gram |
|---|---|
| 24K | AED 517.00 |
| 22K | AED 478.75 |
| 21K | AED 459.00 |
| 18K | AED 393.50 |
The same source shows that 24K gold was AED 516.25 per gram on September 23, compared with AED 526.00 on September 22. This illustrates the sharp short-term movement that has characterized Dubai's gold market during the week.
Khaleej Times separately reported that 24K gold opened at approximately AED 517 per gram on Thursday, while spot gold was around $4,291.30 per ounce at 9:00 a.m. UAE time.
Because gold prices can change several times during a trading session, Dubai buyers, sellers, wholesalers and jewellery businesses should treat quoted rates as time-sensitive market indications rather than fixed prices for the entire day.
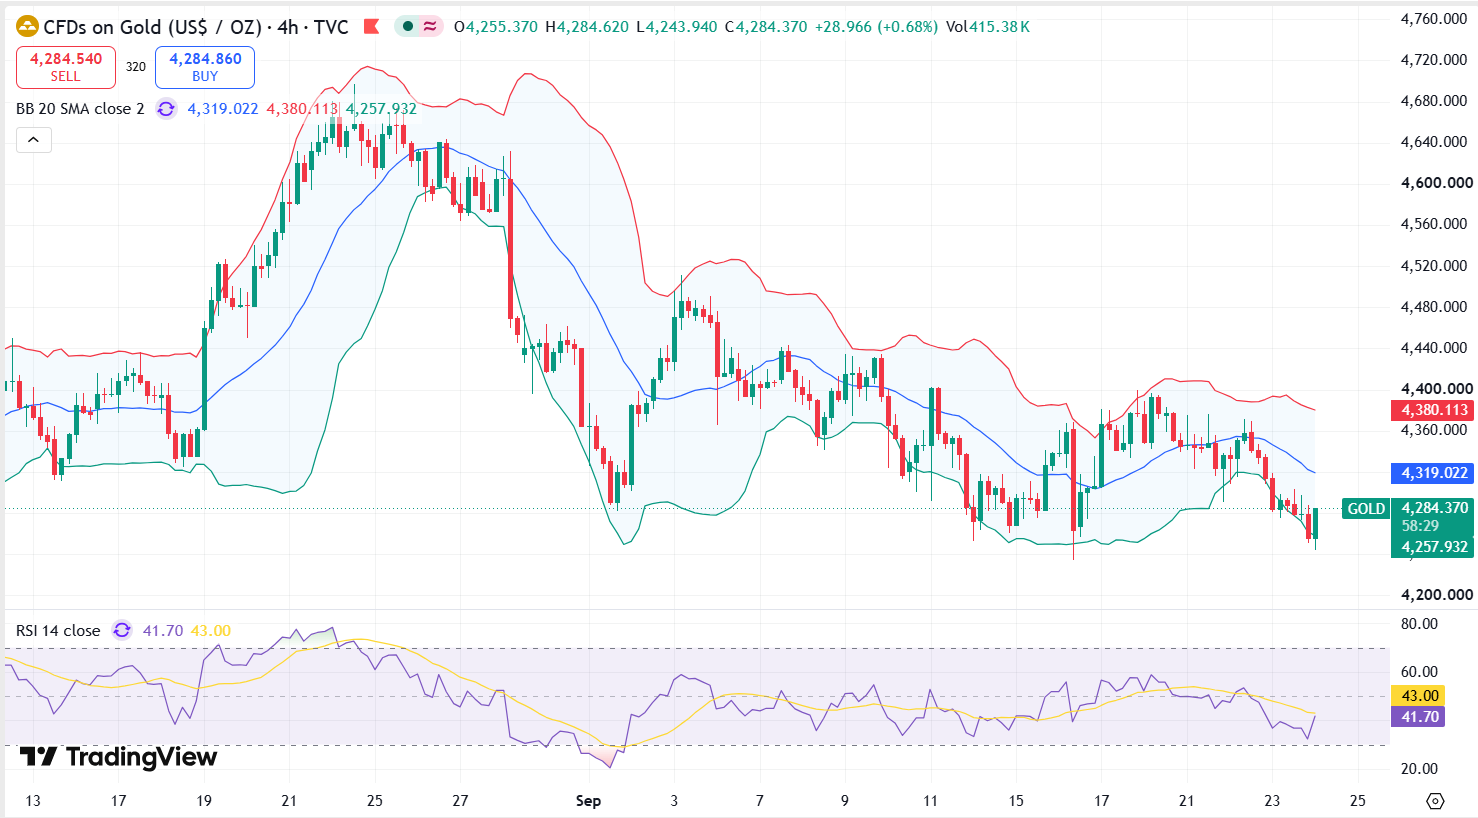
XAU/USD Gold Technical Analysis for 24 September 2026
The international gold market is currently showing a softer technical structure.
An intraday technical snapshot from Investing.com on September 24 showed gold around $4,315.97 per ounce, with the overall technical summary classified as "Strong Sell" at that particular observation.
The moving-average structure is important because gold was trading below the short-, medium- and longer-term averages in that snapshot:
- 5-period SMA: approximately $4,320
- 10-period SMA: approximately $4,323
- 20-period SMA: approximately $4,327
- 50-period SMA: approximately $4,355
- 100-period SMA: approximately $4,378
- 200-period SMA: approximately $4,365
The corresponding exponential moving averages were also positioned above the market. This configuration indicates that sellers had control of short-term momentum at the time of the observation.
However, another intraday technical snapshot later in the day showed gold closer to $4,296, highlighting the volatility and the importance of specifying the time at which a technical reading is taken.
RSI Signals Weak Momentum
The Relative Strength Index is another important indicator for today's gold technical analysis.
The September 24 technical reading showed an RSI(14) around 39.7 in one intraday snapshot, which is below the neutral 50 area and consistent with weak momentum.
A later reading showed RSI close to 32, moving the indicator closer to the commonly monitored oversold threshold of 30.
An RSI approaching 30 does not automatically mean gold must rise. It indicates that downward momentum has become relatively strong and that the market may become more sensitive to short-covering or bargain buying.
MACD Remains Bearish
The MACD indicator is also showing negative momentum. The September 24 technical snapshot recorded a negative MACD reading, supporting the broader indication that downside momentum remains present.
For traders following XAU/USD, a potential improvement would require the MACD histogram and signal relationship to stabilize and eventually turn upward. Until such confirmation occurs, rallies may encounter selling interest near short-term moving averages.
Gold Support Levels to Watch
Support is becoming increasingly important as gold moves away from the September highs.
The $4,320 area is particularly significant because it has been identified as an important technical reference around the 200-day EMA in recent Dubai market commentary.
Key technical reference zones include:
- $4,320: Important technical reference and near-term decision area.
- $4,300: Psychological round-number support.
- $4,280–$4,260: Potential secondary downside zone if $4,300 fails decisively.
- $4,240: A deeper technical support area identified in market analysis.
- $4,200: Important psychological and technical level for a larger correction.
These should be regarded as technical reference zones rather than guaranteed turning points. A decisive daily close below a support area can change the market structure and expose the next lower level.
Gold Resistance Levels to Watch
On the upside, gold needs to recover several resistance areas before the short-term technical structure can improve materially.
The first hurdle is around $4,320–$4,330, where recent pivot and moving-average readings cluster.
The next important area is approximately $4,350–$4,365, corresponding broadly with the 50- and 200-period moving-average territory in recent technical readings.
Above that, the market would encounter the more significant $4,400–$4,440 resistance zone.
A possible technical roadmap is:
$4,320 → $4,350 → $4,365 → $4,400 → $4,440
A sustained break and close above the higher resistance zones would provide stronger evidence that the recent correction is losing momentum.
Why Is Gold Falling Today?
The latest gold decline is closely connected to changes in the US interest-rate and bond-market outlook.
The Federal Reserve raised its target interest-rate range by 25 basis points in September to 3.75%–4.00%. The move and accompanying signals contributed to a stronger US dollar and pressure on non-yielding gold.
Higher interest rates can increase the opportunity cost of holding gold because bullion does not generate a conventional interest payment. When government bond yields rise, some investors may therefore prefer yield-bearing assets.
US Treasury yields have also moved significantly higher. Federal Reserve data for September 22 showed the US 10-year Treasury yield at approximately 4.96%, while the 2-year yield was around 4.71%.
More recent market commentary on September 24 reported the 10-year yield moving above 5%, while a stronger dollar added further pressure to XAU/USD.
Oil Prices Are Another Important Gold Driver
Oil prices have become increasingly relevant to gold's 2026 performance because higher energy prices can add to inflation expectations.
If energy prices remain elevated, central banks may face greater difficulty bringing inflation down. That can lead markets to anticipate tighter monetary policy for longer, potentially supporting bond yields and the US dollar.
This creates a complicated environment for gold.
Gold is traditionally viewed by investors as a store of value and an inflation hedge. However, if inflation concerns cause interest rates and real yields to rise substantially, the monetary-policy response can temporarily offset some of gold's inflation-hedging appeal.
Gold Market Performance in September 2026
Dubai's local gold rates illustrate the extent of recent volatility.
The Dubai Gold & Jewellery Group data reported by Gulf News show 24K gold at AED 542 per gram on September 3, rising to AED 554.50 on August 27, before moving lower through September. By September 24, the 24K rate stood at approximately AED 517 per gram.
The decline has not been a straight line. Gold experienced sharp daily rebounds, particularly around the Federal Reserve meeting and changing expectations for interest rates.
Internationally, gold rose to around $4,390.11 per ounce on September 18, before subsequently falling as markets reassessed the interest-rate outlook.
That price action demonstrates why gold traders should avoid interpreting a single day's movement in isolation.
Gold Technical Outlook: Bullish Recovery or Further Correction?
The current chart structure is cautious.
From a purely technical perspective, the fact that XAU/USD is trading below several key moving averages indicates that sellers have maintained short-term control. Momentum readings are also predominantly negative.
Nevertheless, the market is approaching areas where a technical rebound could develop.
A recovery above $4,320 would be an initial sign that selling pressure is easing. A move through the $4,350–$4,365 region would provide additional evidence of improving momentum.
A stronger recovery above $4,400 would put the September resistance structure back into focus.
Conversely, sustained trading below $4,300 would keep attention on lower support areas. A decisive break below the $4,240 region could indicate that the correction is becoming deeper.
What Does This Mean for Gold Trade in Dubai?
Dubai remains one of the world's major gold trading and jewellery markets, making international price movements particularly relevant for wholesalers, retailers, investors and jewellery buyers.
For businesses involved in gold trade in Dubai, the current environment suggests that daily price monitoring is especially important. A change of even a few dollars per ounce in international gold can translate into noticeable movements in the per-gram AED quotation.
Businesses should monitor:
- International spot gold and futures prices.
- The US dollar direction.
- US Treasury yields.
- Federal Reserve statements and rate expectations.
- Crude oil prices.
- Geopolitical developments.
- Dubai Gold & Jewellery Group quotations.
- Local jewellery premiums and making charges.
- Customer demand for 24K, 22K and other purities.
The local AED price should not be viewed as an isolated number. Dubai's gold market is part of a global pricing system in which international bullion prices remain a major reference point.
24K, 22K and 18K Gold: What Is the Difference?
The gold rate varies according to purity.
24K gold represents very high-purity gold and is generally the closest retail reference to the international bullion market.
22K gold contains less pure gold than 24K and is widely used in jewellery markets, including the Gulf and South Asian markets.
18K gold contains a lower proportion of pure gold and is commonly used for jewellery requiring additional alloy strength and different design characteristics.
On September 24, Dubai's indicative rates were approximately AED 517 for 24K, AED 478.75 for 22K and AED 393.50 for 18K per gram.
Actual purchase or selling prices can differ depending on the product, dealer, workmanship, premiums, transaction size and other commercial factors.
Gold Trading Risk Management on 24 September 2026
The current market environment demonstrates why risk management is essential.
Gold has historically been considered a defensive asset, but defensive assets can still experience substantial corrections. The 2026 market has already demonstrated significant volatility, with gold reaching much higher levels earlier in the year before retreating.
A technical trader may therefore monitor confirmation rather than relying on a single indicator.
Potential Recovery Scenario
- Gold stabilizes above a major support area.
- Momentum indicators begin to recover.
- XAU/USD reclaims short-term moving averages.
- A sustained break above resistance occurs.
- The dollar and Treasury-yield environment provide confirmation.
Potential Downside Scenario
- Gold fails to hold $4,300.
- Selling momentum increases.
- Treasury yields continue to rise.
- The US dollar strengthens.
- The $4,240 support region breaks.
These are market scenarios, not guaranteed forecasts.
Gold Price Outlook for Dubai
The immediate Dubai gold outlook remains closely tied to the international XAU/USD market.
At approximately AED 517 per gram for 24K gold on September 24, Dubai prices are already below several September readings.
If international gold stabilizes around the $4,300 area and subsequently recovers above $4,320–$4,365, Dubai prices could receive upward pressure. Conversely, a sustained international decline below major support could translate into lower local bullion quotations.
The next major directional signal is therefore likely to come from the interaction between gold price, US Treasury yields, the US dollar and Federal Reserve expectations.
Frequently Asked Questions About Gold Technical Analysis – 24 September 2026
What is the gold price in Dubai today?
On September 24, 2026, the reported Dubai 24K gold rate was approximately AED 517 per gram, with 22K around AED 478.75 and 18K around AED 393.50 per gram. Rates can change throughout the trading day.
What is the current XAU/USD gold price?
Intraday market observations on September 24 placed spot gold broadly around the $4,300–$4,320 per ounce area, although prices were moving rapidly during the session.
Is gold technically bullish or bearish today?
The short-term technical structure is under pressure. Recent technical snapshots show gold below multiple moving averages, with RSI and MACD readings indicating negative momentum.
What is the important support level for gold?
The $4,320 area is an important technical reference, while $4,300 and the $4,260–$4,240 region become increasingly important if selling continues. Technical levels can change as new price data develops.
What is the major resistance level for gold?
The $4,350–$4,365 area is an important intermediate resistance region, while $4,400–$4,440 represents a larger resistance zone identified in recent market analysis.
Why are higher US interest rates affecting gold?
Higher interest rates can increase the relative attractiveness of interest-bearing assets compared with gold, which does not pay interest. Higher yields can therefore create headwinds for bullion, particularly when accompanied by a stronger US dollar.
Conclusion: Gold Technical Analysis Report for 24 September 2026
The Gold Technical Analysis Report for 24 September 2026 points to a market under short-term pressure but approaching technically significant levels.
Dubai's 24K gold price is around AED 517 per gram, while international XAU/USD prices are fluctuating around the low-$4,300s.
The technical picture remains cautious because gold is trading below several key moving averages and momentum indicators are predominantly negative. At the same time, an RSI approaching the lower end of its recent range means the market could become increasingly responsive to stabilization or short-covering.
The most important technical areas to monitor are $4,300–$4,320 on the downside/support side, $4,350–$4,365 as an intermediate recovery zone, and $4,400–$4,440 as a major resistance area.
For participants in gold trade in Dubai, the next phase of the market will depend not only on chart patterns but also on the direction of US Treasury yields, the US dollar, Federal Reserve policy expectations, oil prices and geopolitical risk.
Gold therefore enters the remainder of September with a technically weaker short-term structure, but the market remains highly sensitive to macroeconomic developments. Traders, investors, jewelers and bullion businesses should monitor live prices and confirmed market levels rather than relying on a single daily quotation.