
September 28, 2026
Published: 28 September 2026
Market: Gold / XAU/USD
Location: Dubai, UAE
Gold faces renewed selling pressure as a stronger US dollar, rising yields, higher oil prices and Federal Reserve policy expectations weigh on XAU/USD.
Gold Price Today: XAU/USD Under Heavy Selling Pressure
Gold entered the final week of September under renewed selling pressure, with XAU/USD falling more than 2% on Monday, 28 September 2026. A stronger US dollar, rising oil prices and expectations surrounding Federal Reserve policy have combined to create a challenging short-term environment for bullion.
Spot gold was down approximately 2.7% at $4,171.85 per troy ounce at 06:27 GMT on 28 September, while US gold futures were also lower.
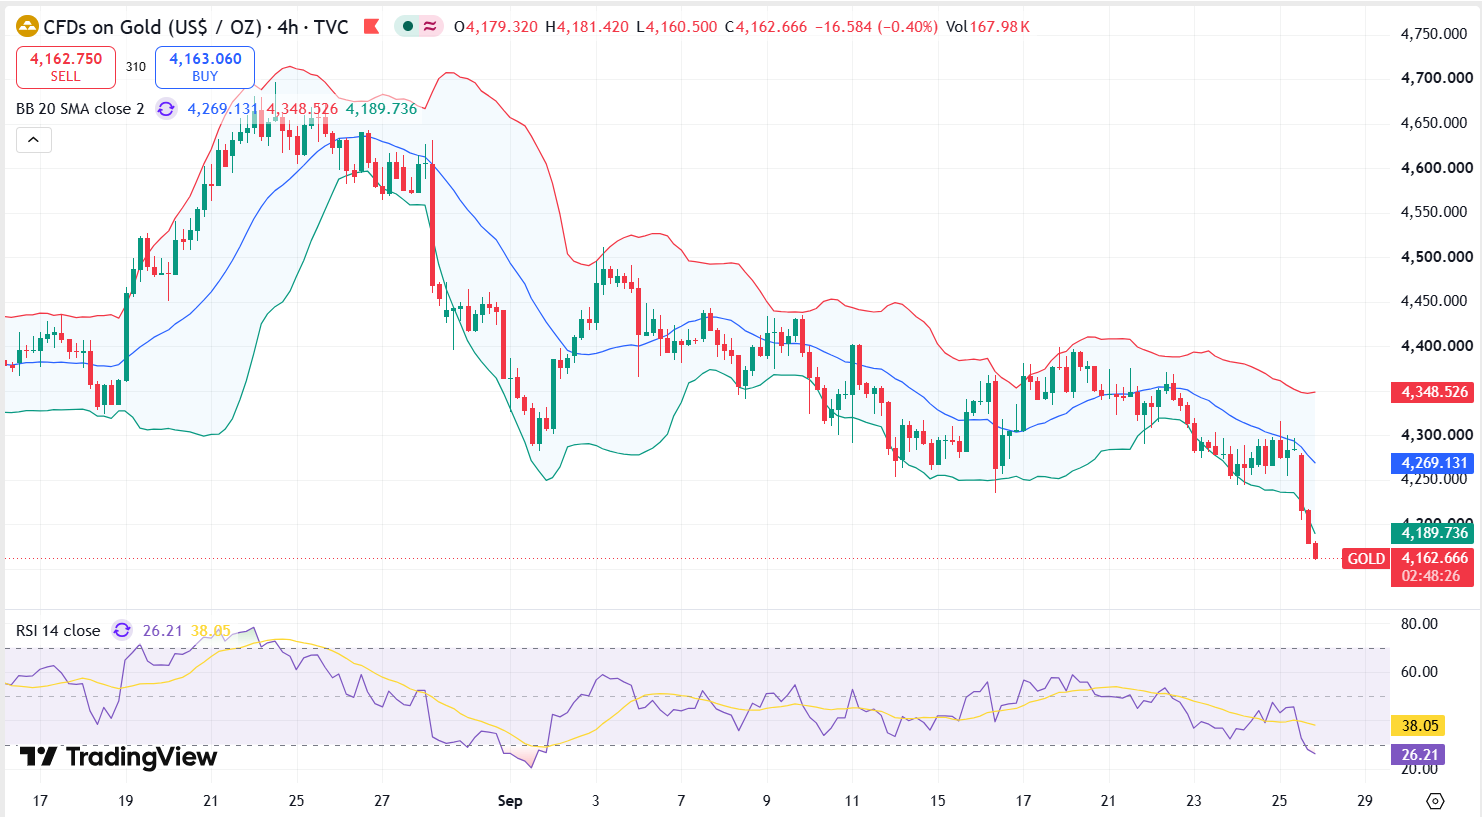
The latest move has pushed gold toward technically important levels. The $4,200 per ounce region has become a central short-term reference point for traders monitoring XAU/USD.
Gold prices are continuously changing during global trading sessions. Different market-data providers may therefore display slightly different prices depending on their data feed and update time.
Gold Technical Analysis for 28 September 2026
The daily technical structure has weakened considerably. Gold is trading below several important moving averages, while momentum indicators show increasing selling pressure.
Current technical assessments place gold around the $4,200 region, below the 100-day simple moving average near $4,299, the 50-day SMA around $4,321, the 21-day SMA near $4,344 and the 200-day SMA around $4,541.
RSI(14) around 28.5, while MACD remained negative. Differences between technical platforms are normal because indicator calculations depend on the precise price feed and candle timing.
The broader technical message is that gold's short-term momentum has weakened significantly. However, an oversold indicator alone does not confirm that a sustained reversal has started.
Gold Support and Resistance Levels
Key Support Levels
- $4,200 – Immediate psychological support
- $4,180–$4,160 – Near-term downside monitoring zone
- $4,000–$3,990 – Major structural support area
Key Resistance Levels
- $4,240–$4,300 – Initial recovery and resistance zone
- $4,320–$4,345 – Important moving-average resistance
- $4,500–$4,540 – Major higher resistance region
Moving Averages Show a Bearish Short-Term Structure
Moving averages remain an important component of the current gold technical analysis. Several short- and medium-term averages are positioned above the prevailing XAU/USD price.
| Indicator | Approximate Level | Technical Interpretation |
|---|---|---|
| MA5 | $4,285 | Resistance |
| MA10 | $4,305 | Resistance |
| MA20 | $4,314 | Resistance |
| MA50 | $4,311 | Resistance |
| MA100 | $4,338 | Resistance |
| MA200 | $4,358 | Resistance |
The exact values can differ between data providers because of differences in market feeds and calculation periods. Nevertheless, the overall technical structure indicates significant overhead resistance.
RSI and MACD: Gold Momentum Remains Under Pressure
Momentum indicators provide an additional perspective on the current gold market.
RSI approaching or entering oversold territory. An RSI reading below 30 is traditionally considered an oversold condition, although oversold markets can remain oversold during strong trends.
MACD readings are also negative on current technical dashboards. This supports the interpretation that short-term downside momentum remains established.
Traders should therefore distinguish between an oversold condition and a confirmed trend reversal. Confirmation would generally require improving momentum and a sustained recovery through important resistance levels.
Why Is Gold Falling Today?
The latest gold sell-off is being influenced by several interconnected macroeconomic factors, including oil prices, inflation expectations, US Treasury yields, the US dollar and Federal Reserve monetary-policy expectations.
Rising oil prices can increase inflation concerns. If markets expect inflation to remain elevated, investors may anticipate restrictive monetary policy for longer.
Higher interest rates and Treasury yields can increase the opportunity cost of holding non-yielding gold. At the same time, a stronger US dollar can place additional pressure on dollar-denominated bullion.
These factors have recently combined to create a challenging environment for gold prices.
Federal Reserve Policy Remains a Major Gold Market Catalyst
The Federal Reserve raised its target federal funds rate by 25 basis points on 16 September 2026, taking the target range to 3.75%–4.00%.
The Federal Reserve stated that inflation remained elevated and that the latest policy action was intended to support a return toward its 2% inflation objective.
The expected path of US monetary policy remains one of the most important fundamental variables for XAU/USD during the final quarter of 2026.
Expectations for additional tightening can support the US dollar and Treasury yields, both of which can create headwinds for gold.
US Inflation and Employment Data Could Trigger the Next Major Gold Move
The US economic calendar is particularly important for gold traders during the final week of September.
Employment and inflation-related economic data can influence expectations for Federal Reserve policy, Treasury yields and the US dollar.
Strong employment data may reinforce expectations for restrictive monetary policy when inflation remains elevated. Conversely, signs of labour-market weakness could affect expectations for future interest-rate policy.
For XAU/USD traders, the market reaction in Treasury yields and the dollar can be as important as the headline economic data itself.
Oil Prices Are an Important Variable for Gold
The relationship between crude oil and gold has become particularly important in the current market environment.
Higher oil prices can support gold through increased inflation expectations. However, if the oil-price increase causes investors to expect central banks to maintain higher interest rates, rising yields can instead create pressure on bullion.
Gold traders should therefore monitor how oil-price changes affect inflation expectations, Treasury yields and Federal Reserve rate expectations rather than focusing only on the direction of crude oil itself.
Fundamental Support for Gold Has Not Disappeared
Despite the September correction, several longer-term fundamentals continue to support global gold demand.
World Gold Council data showed strong gold-backed ETF inflows during August 2026. Global ETF holdings increased to approximately 4,189 tonnes, while assets under management also increased.
Central-bank demand remains another important structural factor. World Gold Council data indicated approximately 289 tonnes of central-bank purchases during the second quarter of 2026.
Global gold demand therefore remains supported by institutional investors, central banks, physical-market participants and investment demand even while short-term market prices experience corrections.
China Adds Another Layer to the Global Gold Demand Story
China remains one of the world's most important gold markets. Reports indicated that Chinese gold imports exceeded 1,000 tonnes during the first eight months of 2026.
Strong physical and investment demand from China can contribute to the broader structural demand picture even when futures and spot markets experience short-term liquidation.
Chinese demand is therefore an important factor for traders assessing the difference between short-term price momentum and longer-term gold-market fundamentals.
Dubai Gold Market Perspective
Dubai remains closely connected to international gold pricing because local bullion prices ultimately reflect global XAU/USD prices together with the UAE dirham's relationship with the US dollar, local premiums, dealer spreads, fabrication costs and retail-market factors.
The UAE dirham maintains its fixed relationship with the US dollar. Using an indicative USD/AED conversion near 3.6725, a theoretical gold price of $4,200 per troy ounce corresponds to approximately AED 495.5 per gram before local premiums, dealer spreads, fabrication charges and other retail adjustments.
This theoretical conversion should not be treated as an actual Dubai jewellery-shop quotation because retail gold prices can differ depending on product type, dealer, making charges and other commercial factors.
Gold Trading Levels to Watch on 28 September 2026
Bullish Recovery Scenario
A sustained recovery above $4,200 could encourage short-covering and improve the immediate technical picture. A move through approximately $4,240–$4,300 would provide additional evidence that selling pressure is weakening.
A stronger technical recovery would require XAU/USD to reclaim the $4,320–$4,345 region, where several moving averages and trend references converge.
A move above the $4,500 region would represent a much larger change in the medium-term technical structure.
Bearish Continuation Scenario
A sustained break below $4,200 would keep the immediate downside structure intact.
Traders can then monitor the $4,180–$4,160 area, followed by the major psychological and structural support around $4,000.
A decisive break below $4,000 would represent a significant technical development and would require a reassessment of the longer-term chart structure.
Gold Outlook for the Week Ahead
Rather than relying on a single directional forecast, gold traders should monitor the interaction between price action, momentum and macroeconomic confirmation.
- XAU/USD reaction around the $4,200 level.
- US Treasury yield direction.
- US Dollar Index momentum.
- Federal Reserve interest-rate expectations.
- US employment and inflation data.
- Oil-price developments.
The technical market is currently under pressure, but momentum indicators are becoming increasingly stretched. This combination can produce sharp countertrend rebounds even while the broader short-term structure remains weak.
The key distinction for traders is between a temporary technical bounce and a confirmed trend reversal. A bounce from oversold conditions does not independently establish a new uptrend.
Gold Technical Analysis Report – Key Takeaways
Gold's 28 September 2026 sell-off represents a significant deterioration in the short-term XAU/USD price structure.
Spot gold has moved below the psychologically important $4,200 region while the US dollar, Treasury yields and expectations surrounding US monetary policy have created additional pressure on bullion.
At the same time, the broader fundamental picture remains more complex. Gold-backed ETF holdings, central-bank purchases, physical demand and Chinese imports remain important structural factors for the market.
Technically, gold is below several major moving averages, MACD momentum is negative and some RSI calculations are approaching oversold conditions.
For Dubai gold traders, the $4,200 level remains an immediate technical reference, followed by the $4,180–$4,160 zone and the larger $4,000 support area.
On the upside, $4,240–$4,300 and $4,320–$4,345 represent important recovery and resistance zones.
The next major catalysts include US economic data, Federal Reserve expectations, Treasury yields, the US dollar and oil-price developments.
Frequently Asked Questions About Gold Technical Analysis
What is the key gold support level on 28 September 2026?
The $4,200 area is the immediate psychological support zone. Below it, traders can monitor approximately $4,180–$4,160, followed by the major $4,000 region.
What is the major resistance for XAU/USD?
Initial resistance can be monitored around $4,240–$4,300, followed by approximately $4,320–$4,345.
Why is gold falling on 28 September 2026?
Gold is being pressured by a stronger US dollar, higher yields, rising oil prices and expectations surrounding Federal Reserve monetary policy.
Is gold oversold?
Some technical indicators are approaching or have entered oversold territory. However, an oversold reading does not independently confirm a trend reversal.
What should Dubai gold traders watch?
Dubai traders should monitor international XAU/USD prices, US Treasury yields, the US Dollar Index, Federal Reserve expectations, oil prices and major US economic releases.
Market Data and Research Sources
- Reuters – Gold market and macroeconomic reporting
- Federal Reserve – Monetary policy information
- World Gold Council – Gold demand, ETF and central-bank data
- US Bureau of Labor Statistics – Economic calendar
- Central Bank of the UAE – Monetary and exchange-rate information
- Technical market-data providers – XAU/USD indicators and moving averages
Disclaimer
Gold prices, technical indicators, Treasury yields, exchange rates and other market information are subject to change. Technical levels are analytical reference points and are not guaranteed support or resistance levels.
This article is provided for general market information and does not constitute investment, financial, trading or legal advice. Readers should conduct their own research and consider their individual circumstances before making financial decisions.
Dubai retail gold prices may differ from international spot-equivalent calculations because of premiums, dealer spreads, making charges, taxes and other commercial factors.