
August 19, 2026
Gold Technical Analysis Report: 19 August 2026 – Navigating Market Volatility
Market Update: As of 19 August 2026, the gold market (XAU/USD) is exhibiting signs of stabilization after a period of intense volatility. Currently trading at $4,367/oz, the precious metal is finding its footing within a defined intraday range of $4,325 to $4,369.
For investors in Dubai and global markets, understanding these price movements is critical. This technical analysis report—brought to you by Gold Trade—breaks down the key drivers, support/resistance levels, and the outlook for gold in the current macroeconomic climate.
Current Market Sentiment: Consolidation After the Rebound
The gold price has experienced a rollercoaster start to the week. Following an intraday high near $4,435 on 18 August, prices witnessed a sharp correction, sliding roughly $111 (approximately 2.5%) to touch a low of $4,325 in the early hours of 19 August.
However, the bounce-back toward the $4,367 level indicates that buyers remain active at lower price points. The market is currently in a consolidation phase, where traders are weighing conflicting signals: cooling U.S. interest rate expectations against persistent geopolitical premiums.
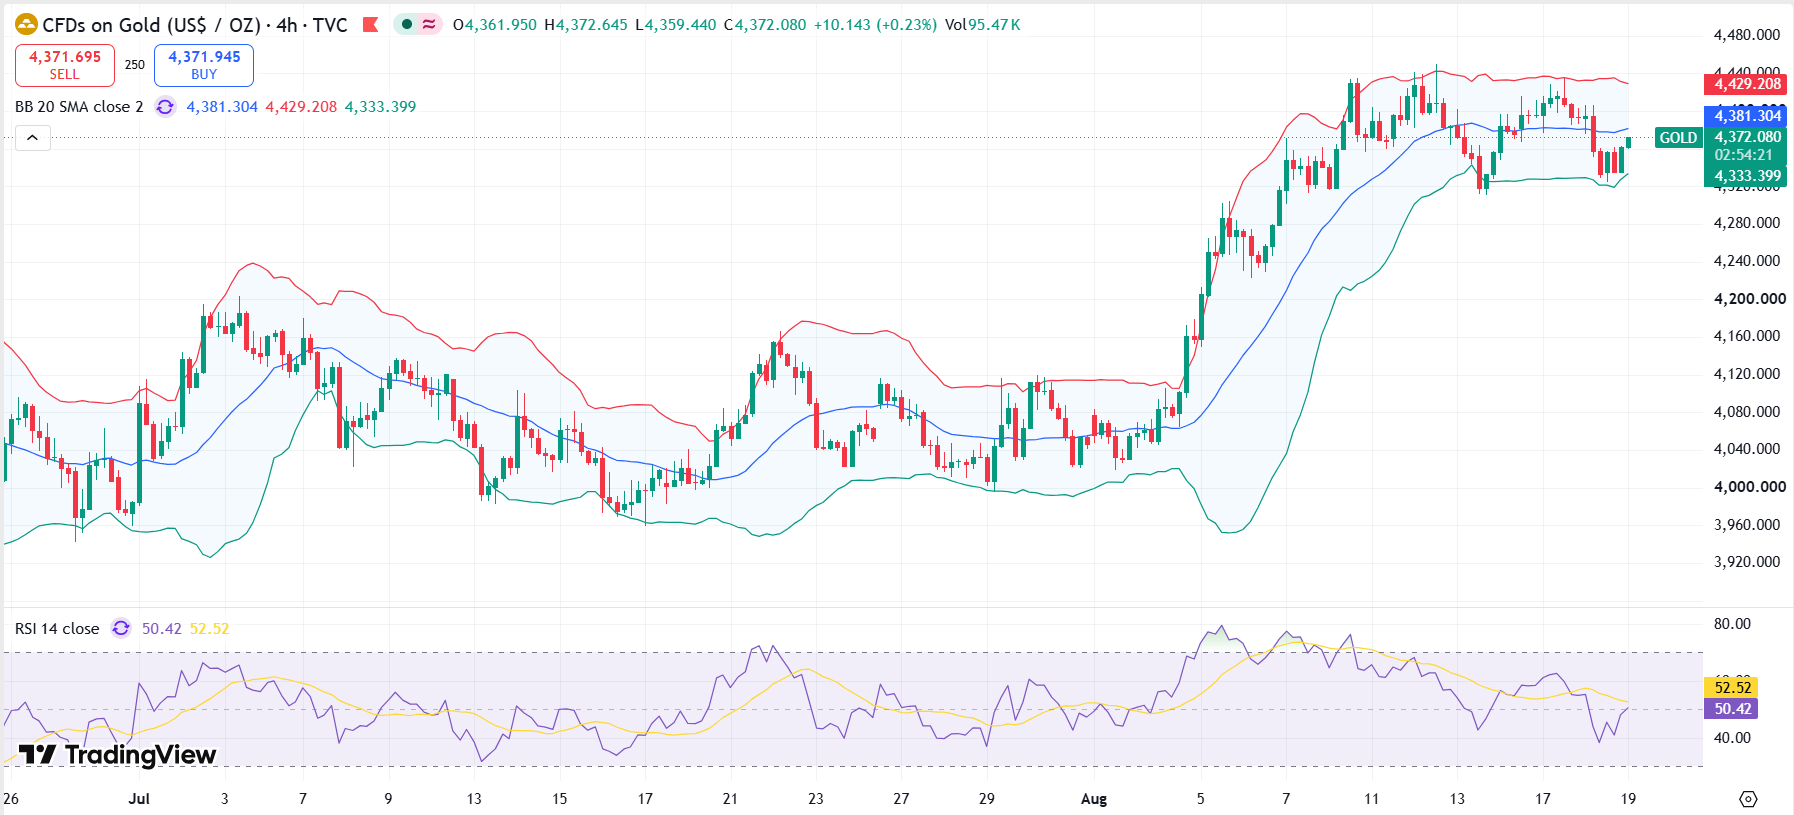
Key Technical Levels to Watch
For short-term traders and long-term bullion investors, technical levels serve as a roadmap for entry and exit strategies.
Resistance Zones (Upside Targets)
- Immediate Resistance ($4,370): A decisive break above this level is required to neutralize recent selling pressure.
- Psychological Pivot ($4,450): This early-August peak remains the major hurdle for bulls. Reclaiming this level would signal a potential return to the bullish trend observed earlier this year.
Support Zones (Downside Protection)
- Current Support ($4,325): The recent overnight low acts as the first line of defense.
- Structural Support ($4,300–$4,200): If selling momentum accelerates, these levels provide significant historical support.
- Critical Floor ($4,146–$4,100): The 50-day moving average sits in this range, representing the ultimate line of support for the medium-term uptrend.
Fundamental Drivers: Why Gold Remains Resilient
Despite the short-term fluctuations, the underlying narrative for gold in 2026 remains robust. Several structural factors are keeping prices at these elevated historical levels:
- Fed Rate Cut Expectations
Markets have scaled back bets for a Federal Reserve interest rate hike in September 2026, with probability estimates hovering around 35%. As expectations for a dovish pivot grow, the U.S. Dollar often softens, making gold—a non-yielding asset—more attractive to international investors.
- Geopolitical Risk Premium
The Strait of Hormuz crisis, ongoing since February 2026, continues to act as a "fear gauge" for the global economy. Because this waterway facilitates approximately one-quarter of the world’s seaborne oil trade, any news of escalation triggers immediate safe-haven demand for gold.
- Central Bank Accumulation
Central banks globally continue to purchase gold at a historic pace to diversify reserves away from fiat currencies. With net purchases of 289 tonnes in Q2 2026, institutional demand is providing a "floor" to the market, preventing deeper corrections during periods of profit-taking.
Gold Strategy for Dubai Investors
Dubai remains one of the world's most efficient gold trading hubs, offering unparalleled transparency for both retail buyers and institutional investors.
- Portfolio Diversification: Financial experts generally recommend a 5–10% allocation to precious metals for conservative portfolios, and up to 15–20% for those seeking crisis protection.
- Wealth Preservation: With global inflation remaining a persistent concern, gold continues to serve its historical role as a hedge against currency debasement.
- The "Buy the Dip" Approach: Given the structural support from central banks, many analysts view market pullbacks—such as the move toward the $4,325 support level—as strategic opportunities to accumulate physical gold for long-term holding.
Conclusion: What to Expect Next
The XAU/USD pair is expected to remain range-bound between $4,313 and $4,441 in the immediate term as the market digests recent economic data. Investors should monitor upcoming U.S. labor reports and regional Middle East headlines, as these remain the primary catalysts for volatility.
At Gold Trade, we advise clients to maintain a balanced perspective. While short-term technicals suggest caution, the long-term fundamentals driven by central bank demand and geopolitical uncertainty remain firmly bullish.
Disclaimer: This report is for informational purposes only and does not constitute financial advice. Gold prices are subject to market volatility. Always conduct your own due diligence or consult with a certified financial advisor before making investment decisions.