
September 05, 2026
Weekly Gold Technical Analysis Report - 07–11 Sept 2026: XAU/USD Consolidates at $4,429 After Extreme $125 Friday Session Range
Dubai, UAE — September 07, 2026 — Spot gold (XAU/USD) enters the second trading week of September 2026 under intense market scrutiny following a highly volatile Friday session. Capitalizing on sharp intra-week liquidity shifts, gold exhibited an expansive daily price movement of $125.18 per troy ounce on Friday. The session opened at $4,472.36, vaulted to an intraday high of $4,490.85, succumbed to aggressive profit-taking that dragged prices down to a low of $4,365.67, and ultimately settled in an equilibrium recovery phase to close at $4,429.92.
This dynamic price trajectory underscores a crucial tug-of-war in the precious metals market. While short-term macroeconomic headwinds and US Dollar fluctuations triggered intense institutional position adjustment from the $4,490 peak, resilient physical demand across physical trading hubs like Dubai provided robust structural support near the $4,365 floor.
As global markets prepare for key economic prints during the week of September 07–11, 2026, Gold Trade delivers this detailed technical and fundamental intelligence report to navigate upcoming trading opportunities across XAU/USD futures, spot contracts, and regional physical bullion transactions.
- Friday Session Price Action & Market Microstructure
To understand the directional framework for the week ahead, market participants must first analyze the structural mechanics behind Friday's dramatic trading session:
- Opening Price ($4,472.36): Spot gold opened Friday's session in positive territory, maintaining the multi-week constructive momentum generated during late August.
- Session High ($4,490.85): Morning buying momentum pushed XAU/USD within striking distance of the psychological $4,500 threshold. However, heavy supply overhang and automated sell orders near $4,490 capped the advance, initiating a rapid liquidity sweep.
- Session Low ($4,365.67): The ensuing afternoon sell-off drove prices down by $125.18 from the daily high. The decline was halted precisely as price interacted with dynamic daily moving average clusters and institutional buy-side liquidity resting between $4,360 and $4,368.
- Friday Close ($4,429.92): Dip-buyers aggressively absorbed supply at the lows, engineering a $64.25 recovery into the weekend close. Closing at $4,429.92 positioned gold right near its 50% intraday equilibrium level, leaving a long lower shadow (wick) on the daily candlestick chart.
This candlestick structure—a classical hammer-like tail following a sharp drop—signals that while sellers dominated the mid-session push, buyers retain strong defensive interest at lower price brackets.
- Multi-Timeframe Technical Analysis
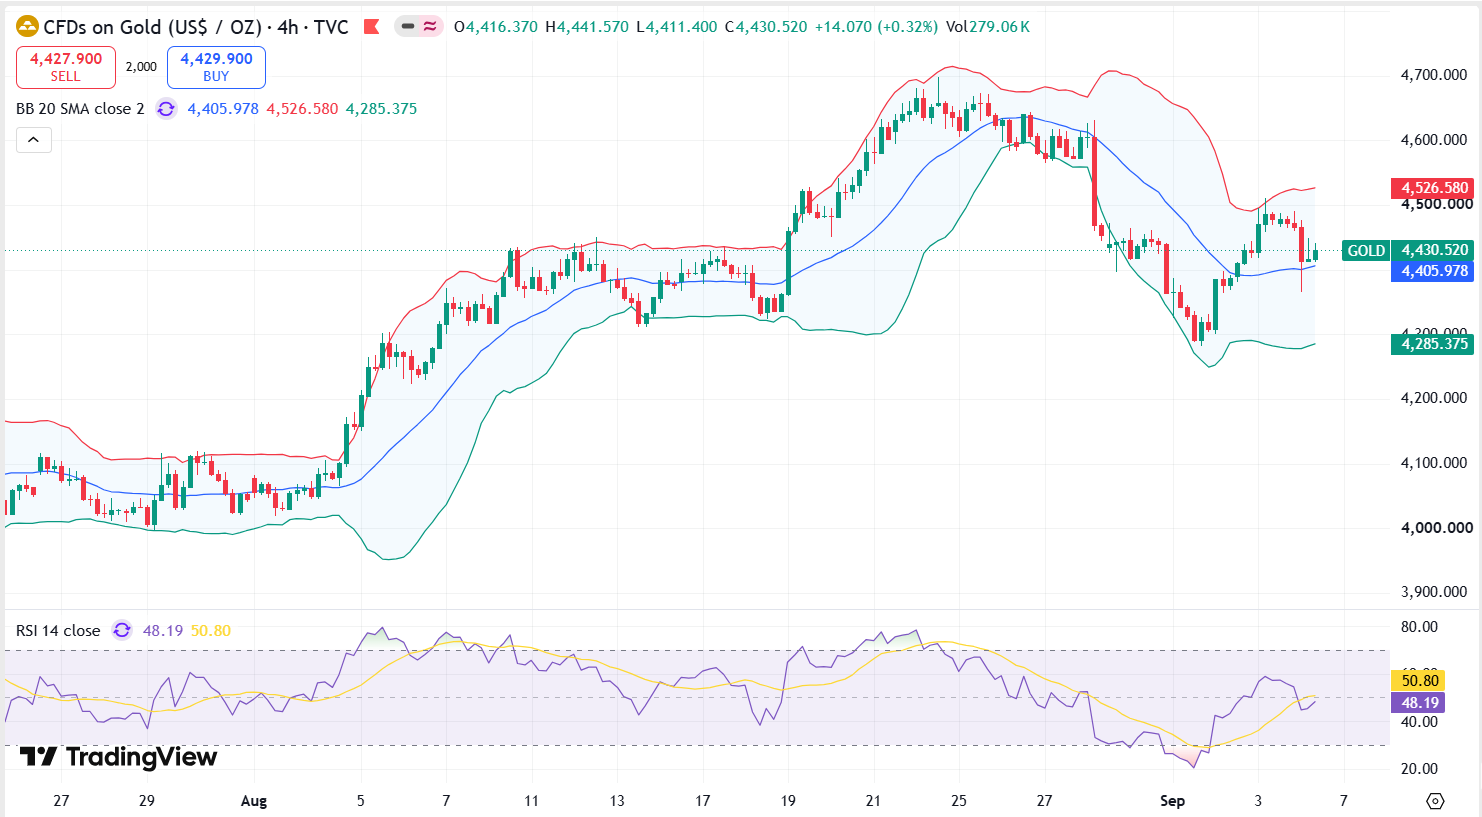
XAU/USD WEEKLY TECHNICAL STRUCTURE
Resistance 3 $4,574.00 [38.2% Macro Fib Pivot] Resistance 2 $4,490.85 [Friday Session High] Resistance 1 $4,472.36 [Friday Open / Pivot] ★ SPOT PRICE $4,429.92 [50% Equilibrium Zone] Support 1 $4,365.67 [Friday Low / Dynamic Floor] Support 2 $4,326.26 [50-Day EMA Confluence] Support 3 $4,311.56 [200-Day EMA Macro Floor] Daily Moving Average Architecture
Analysis of daily Exponential Moving Averages (EMAs) highlights a market undergoing short-term consolidation within a sustained macro bull environment:
- 20-Day EMA ($4,427.32): Friday's closing price of $4,429.92 sits directly atop the 20-day EMA. This alignment reinforces $4,427 as the primary immediate pivot for the week of September 07–11. Holding above this exponential average preserves short-term bullish momentum.
- 100-Day EMA ($4,359.87): Positioned just below Friday's low ($4,365.67), the 100-day EMA represents critical medium-term structural support. The buyer reaction at $4,365 confirmed that institutional funds continue to defend the 100-day trend line.
- 50-Day EMA ($4,326.26): Sitting below the 100-day EMA, the 50-day average forms part of a multi-layered support floor alongside long-term structural targets.
- 200-Day EMA ($4,311.56): The 200-day EMA marks the underlying structural line in the sand. As long as XAU/USD trades above $4,311.56, the overarching long-term macro trend remains decidedly bullish.
Momentum Oscillators: RSI and MACD
- Relative Strength Index (RSI 14): The daily RSI closed Friday at 58.40, down from near-overbought readings of 66.82 earlier in the week. This pullback has successfully cooled oscillator momentum without breaching the 50.0 median line into bearish territory. The RSI reset grants buyers room for an extended upward wave during the week ahead.
- Moving Average Convergence Divergence (MACD): On the daily chart, the MACD histogram shows mild deceleration in positive momentum following Friday's pull from $4,490. However, the main MACD line remains above the signal line and well clear of the zero threshold, confirming that the medium-term trend bias remains constructive.
Fibonacci Retracement Confluence Matrix
Applying Fibonacci analysis from recent swing lows to Friday’s peak of $4,490.85 maps critical intraday and swing reference zones for the coming sessions:
- 23.6% Retracement ($4,461.20): First overhead hurdle required for bulls to regain complete intraday control.
- 38.2% Retracement ($4,442.80): Serves as dynamic minor resistance heading into Monday's Asia-Pacific opening.
- 50.0% Retracement ($4,428.26): Directly coincides with Friday's close ($4,429.92), proving that market pricing is currently balanced at true fair value.
- 61.8% Retracement ($4,413.50): Golden ratio support zone; holding above $4,413 during early-week pullbacks will keep immediate upside targets active.
- Fundamental Market Drivers: September 07–11, 2026
While technical charts define key levels, fundamental macroeconomic catalysts dictate the magnitude of price expansion.
Federal Reserve Rate Expectations & Yield Environment
Market expectations regarding Federal Reserve monetary policy remain the single most influential variable for gold prices. Investors are actively evaluating upcoming US inflation and labor market data to gauge the Fed's rate path:
- Interest Rate Sentiment: Any signals indicating rate cuts reduce real bond yields, lowering the opportunity cost of holding non-yielding gold bullion and fueling price rallies.
- Hawkish Policy Risks: Conversely, sticky inflation or hawkish commentary from central bankers can boost Treasury yields, capping near-term upside attempts.
US Dollar Index (DXY) Dynamics
Spot gold maintains a strong inverse correlation with the US Dollar Index. Friday's mid-session decline in gold was accompanied by a sudden rebound in the DXY as traders adjusted positions ahead of weekend geopolitical developments. If the US Dollar index faces renewed resistance this week, XAU/USD will find immediate tailwinds toward $4,490.
Geopolitical Risk Premium & Central Bank Buying
Geopolitical uncertainty and central bank reserve diversification remain structural macro pillars supporting precious metals. Central banks globally continue to add physical gold to official reserves at a steady pace. This ongoing structural demand acts as a persistent buffer against deep market corrections.
Dubai Physical Gold Market & Regional Arbitrage
In Dubai—known globally as the "City of Gold"—physical trading volume across the Dubai Multi Commodities Centre (DMCC) and the Dubai Gold Souk remains robust.
Retail 24K and 22K gold prices in the UAE closely reflect international spot movements. Based on Friday’s spot close of $4,429.92, local Dubai retail rates remain attractively priced relative to import-duty-burdened markets like India.
This price disparity continues to drive significant physical bullion buying from international tourists, institutional buyers, and regional jewelry trade networks operating within the UAE.
- Key Support, Resistance, and Technical Decision Matrix
To assist institutional clients, bullion traders, and private investors at Gold Trade Dubai, the technical desk has compiled the key price level matrix for the week of September 07–11, 2026:
Level Category Price (USD) Technical Significance & Confluence Actionable Strategy / Trigger Major Resistance 3 (R3) $4,574.00 Macro 38.2% Retracement / Multi-month target Major profit-taking zone for macro long positions Major Resistance 2 (R2) $4,490.85 Friday Session High / Key Liquidity Barrier Breakout confirmation level for rally to $4,530+ Minor Resistance 1 (R1) $4,472.36 Friday Opening Price / Intraday Pivot Immediate upside barrier to reclaim during early week Current Pivot Level $4,429.92 Friday Closing Price / 20-Day EMA Alignment Neutral balance point; watch early week open direction Minor Support 1 (S1) $4,413.50 61.8% Intraday Fibonacci Retracement Aggressive buy-on-dip zone for intraday scalpers Major Support 2 (S2) $4,365.67 Friday Session Low / 100-Day EMA Defense Primary defensive floor; must hold to avoid deeper pull Major Support 3 (S3) $4,326.26 50-Day EMA Confluence Zone Strong institutional accumulation zone - Weekly Trading Scenarios for September 07–11, 2026
Synthesizing chart geometry, moving average structures, and fundamental macroeconomic catalysts, Gold Trade Dubai outlines two primary operational scenarios for the upcoming week:
WEEKLY PRICE PATH SCENARIOS
BULLISH PATH (60%): $4,429.92 → $4,472.36 → $4,490.85 → $4,530.00+
BEARISH PATH (40%): $4,429.92 → $4,413.50 → $4,365.67 → $4,326.26
Primary Scenario: Bullish Continuation & Resistance Test (60% Probability)
- Trigger: XAU/USD holds firm above the 20-day EMA ($4,427.32) during Monday's Asian session and breaks above the $4,472.36 open level.
- Target Pathway: A successful move above $4,472.36 will clear the runway for a retest of Friday’s high at $4,490.85. A decisive daily close above $4,490.85 will trigger short-covering, driving prices toward $4,530.00 (200-period 4-hour SMA) and potentially testing $4,574.00 later in the week.
- Trading Application: Look for long positions on confirmed pullbacks to $4,420–$4,428, setting tight stop-losses below $4,395.
Alternative Scenario: Deeper Technical Correction (40% Probability)
- Trigger: Failure to sustain $4,427 leading to a breakdown below $4,413.50 and a breach of Friday's low at $4,365.67.
- Target Pathway: If sellers force a breakdown beneath $4,365.67, gold will undergo a broader technical adjustment down to the 50-day EMA at $4,326.26, with ultimate macro support resting at the 200-day EMA of $4,311.56.
- Trading Application: Institutional investors and physical bullion buyers should treat any corrective dip toward $4,320–$4,330 as a high-value physical accumulation zone prior to Q4 seasonal strength.
- Strategic Advice for Gold Trade Dubai Clients
As spot gold navigates this high-volatility regime, Gold Trade Dubai recommends a balanced, risk-managed approach tailored to client profile:
- Spot & Futures Traders: Implement strict risk management protocols. Given Friday's $125 daily range, position sizing should be adjusted to accommodate wider stop-loss placements. Utilize $4,427 as your directional barometer.
- Physical Bullion Investors: Physical buyers in Dubai should capitalize on price dips near local support levels. The pull to $4,365 highlighted strong physical buying interest. Accumulating 24K bars or coins during corrective pullbacks offers an attractive hedge against medium-term currency volatility.
- Jewelry Trade & Refineries: UAE jewelry manufacturers and refiners are advised to hedge raw material inventory requirements using price-lock mechanisms around the $4,365–$4,410 support belt.
Strategic Outlook & Market Summary
Friday’s volatile price action—opening at $4,472.36, dipping to $4,365.67, and recovering to close at $4,429.92—demonstrates the underlying elasticity of the gold market. While short-term technical resistance at $4,490 remains a key threshold for bulls to overcome, the aggressive $64 rebound off Friday's low proves that institutional demand remains robust.
With Federal Reserve rate dynamics, US Dollar trends, and regional Dubai bullion flows working in tandem, the week of September 07–11, 2026 presents compelling trading opportunities across the precious metals spectrum.
Disclaimer: The information provided in this Gold Technical Analysis Report is for educational purposes only and does not constitute financial advice. Trading gold and precious metals involves significant risk. Investors should conduct their own research or consult with a professional financial advisor before making any investment decisions.
« Back to News & Reports List