December 08, 2025
Gold Technical Analysis Report - 08 Dec 2025: Dubai's Perspective on the XAU/USD Bull Run
Exclusive Report for Gold Trade, Dubai
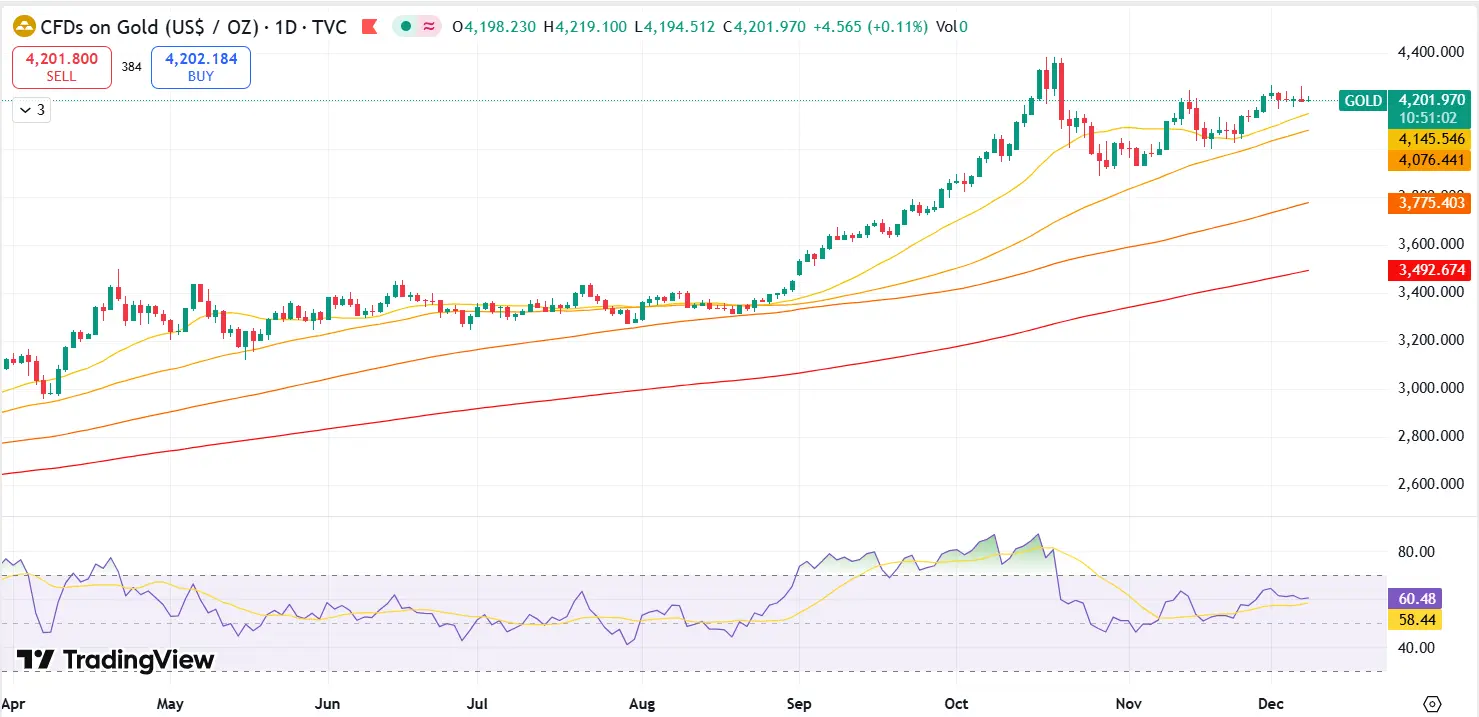
As the global financial year approaches its close, the gold price (XAU/USD) continues to be one of the most compelling narratives in the commodity markets. Trading above the psychologically critical $4,200 level, the yellow metal is riding a robust multi-month uptrend. For our clients at Gold Trade, Dubai, this technical analysis report for December 8, 2025, dissects the key price action, momentum indicators, and crucial support and resistance levels that will define the metal’s trajectory as we enter 2026.
This analysis leverages proprietary trend-following and momentum indicators, providing a strategic outlook for investors, hedgers, and traders interested in physical gold and gold futures.
Key Takeaways for Gold Traders (XAU/USD)
- Dominant Trend: The long-term trend for gold remains unequivocally Bullish, supported by major moving averages and a consistent pattern of higher highs and higher lows.
- Immediate Bias: Short-term momentum appears to be in a consolidation phase following a strong rally, potentially forming a bullish continuation pattern near the $4,200 handle.
- Critical Support: The primary support zone is anchored around $4,190 - $4,205, a confluence of previous resistance and short-term moving averages. A breach below this could trigger a deeper correction.
- Upside Target: The immediate resistance is near the recent high of $4,240 - $4,265. A convincing break above this zone is expected to propel the price toward the all-time high resistance at $4,381.
Price Action and Chart Pattern Analysis
The daily and weekly charts for XAU/USD clearly illustrate a well-defined ascending price channel that has been in place for the better part of 2025. This strong upward trajectory, fueled by persistent central bank demand and sustained geopolitical uncertainty, reinforces gold's status as the ultimate safe-haven asset.
In the last two weeks, the price action has tightened, suggesting an indecisive period or a natural pause after a significant surge. This narrow range, roughly between $4,190 and $4,240, is interpreted by our analysts as a 'Triangle' or 'Flag' pattern—both of which are classic bullish continuation patterns in technical analysis. The breakout from this consolidation phase will be a high-probability trade signal, with volume confirmation being key.
The rejection of a significant move lower following recent profit-taking confirms the depth of buying interest at these elevated levels. The structural integrity of the long-term uptrend is intact, provided the price holds above the critical $4,160 mark.
Key Technical Indicators Deep Dive
Moving Averages (MA)
The configuration of the Moving Averages (MA) provides strong evidence of the underlying bullish trend. The 50-day Exponential Moving Average (EMA) is positioned well above the 200-day Simple Moving Average (SMA) , a classic "Golden Cross" formation that has been in effect since the start of the year and continues to act as a long-term bullish confirmation.
- The 20-day SMA is currently tracking just below the price, providing dynamic support around $4,190. The price remaining above this short-term average is vital for maintaining the near-term bullish bias.
- The 65-day EMA, a proprietary tool for our analysis, is also holding strong below the current price action, confirming that buying pressure remains dominant even during periods of minor correction.
The overall message from the moving averages is clear: Buy Dips that test these dynamic support lines, as the path of least resistance remains to the upside.
Relative Strength Index (RSI)
The Relative Strength Index (RSI) , a crucial momentum oscillator, is currently hovering near the neutral 50-60 level on the daily chart. This is a healthy reading, indicating that the market is neither significantly overbought nor oversold.
- Following the previous move where the RSI momentarily touched the overbought territory (above 70), the recent sideways price action has allowed the indicator to cool off.
- This cooling-off period is essential, as it creates headroom for the next leg up. A break of the recent high accompanied by a surge in the RSI back towards 70 would be a powerful confirmation of renewed bullish momentum.
- In the event of a deeper correction, a bounce from the 40-50 zone on the RSI would be an excellent buy signal for trend-following investors.
Moving Average Convergence Divergence (MACD)
The MACD (Moving Average Convergence Divergence) indicator on the daily chart shows a flattening histogram, which reflects the current low-volatility consolidation. While the MACD line remains above the signal line, confirming the overall bullish structure, the convergence suggests a period of market indecision. A renewed separation with the MACD line pushing higher will signal a re-acceleration of the uptrend. Traders are advised to watch for this renewed upward slope in the MACD as a key entry signal.
Critical Support and Resistance Levels (XAU/USD)
Understanding these levels is non-negotiable for smart gold investment and risk management.
| Type | Level (USD/oz) | Significance | Strategic Action |
|---|---|---|---|
| Resistance 2 | $4,381 | All-Time High / Major Psychological Barrier | Primary long-term target for the current bull run. |
| Resistance 1 | $4,265 | Recent Swing High / Breakout Point from Consolidation | Key level for initiating new long positions. |
| Current Price | $4,220 (Approx.) | Market Consolidation Zone | High-risk zone for new entries; patience advised. |
| Support 1 | $4,190 | Confluence with 20-day SMA and previous resistance | Critical Short-Term Support; a hold confirms the bullish flag. |
| Support 2 | $4,160 | Key Pivot Level / Anchor of the recent uptrend | Break below this would shift the short-term bias to bearish. |
| Support 3 | $4,100 | Major Psychological and Fibonacci Retracement Support | Strong buying interest expected here if S1 and S2 fail. |
Fundamental Backdrop
The technical outlook is strongly supported by the prevailing fundamental factors globally. Expectations of an imminent interest rate cut by the Federal Reserve, combined with a broadly weakening US Dollar Index (DXY), continue to provide a powerful tailwind for gold prices. Furthermore, sustained, record-level demand for bullion from central banks, particularly those in Asia and the Middle East, including regional players, acts as a bedrock of support, limiting downside risks. This robust environment makes gold buying a favored strategy.
Strategic Conclusion
For our sophisticated clientele at Gold Trade, Dubai, the current technical setup on December 8, 2025, suggests that gold is reloading for its next major push higher. The short-term consolidation is a healthy pause within a very powerful uptrend. We maintain a strong long-term bullish bias and advise positioning for a high-probability breakout above $4,265. Risk management is paramount: a sustained break below $4,160 would necessitate a re-evaluation of the near-term bullish outlook.
Stay informed, and trade with precision.
Disclaimer: This report is for informational and educational purposes only and does not constitute financial or investment advice. Always consult with a qualified financial advisor before making investment decisions.
« Back to News & Reports List