December 11, 2025
Silver's Seismic Shift: Technical Analysis Report for XAG/USD - December 11, 2025
Introduction: The White Metal’s Historic Ascent
The global precious metals market has witnessed a watershed year in 2025, and silver (XAG/USD) has been the undisputed star performer. Outpacing its illustrious cousin, gold, the white metal has soared to historic, unchartered highs, firmly establishing itself as both a monetary hedge and a critical industrial asset. Following the pivotal US Federal Reserve decision to cut interest rates on December 10th, the momentum has only intensified.
For investors, refineries, and traders operating in the strategic hub of Dubai precious metals—particularly through leading entities like Gold Trade, Dubai—understanding the current technical landscape of silver is paramount for capitalizing on this historic bull run. This exclusive technical analysis report for December 11, 2025, delves deep into the charts to provide key levels and projections for the metal’s next move.
The Macro-Technical Backdrop: A Confluence of Power
Silver’s blistering 2025 rally—which has seen the price double in value—is underpinned by a powerful confluence of macroeconomic and fundamental factors that are perfectly aligning with a bullish technical setup.
- Industrial Demand Surge: Silver’s indispensable role in the green energy transition (solar photovoltaics) and advanced electronics (driven by the AI technology boom) has created a structural supply deficit, providing a robust fundamental floor. This is a crucial long-term driver for the silver price forecast.
- Dovish Central Banks: The US Federal Reserve’s third rate cut in 2025, with expectations for further easing into 2026, has weakened the US Dollar (USD) and lowered real yields. This drastically reduces the opportunity cost of holding non-yielding assets like silver, fueling massive speculative and institutional inflows.
- The Gold-to-Silver Ratio: The historically high Gold-to-Silver Ratio has aggressively corrected throughout 2025, signaling that silver was significantly undervalued relative to gold. While the ratio has found temporary support, its long-term move favors continued outperformance by silver.
This potent mix provides the conviction necessary to interpret the recent vertical price action through a strong bullish technical bias.
Key Technical Levels for XAG/USD
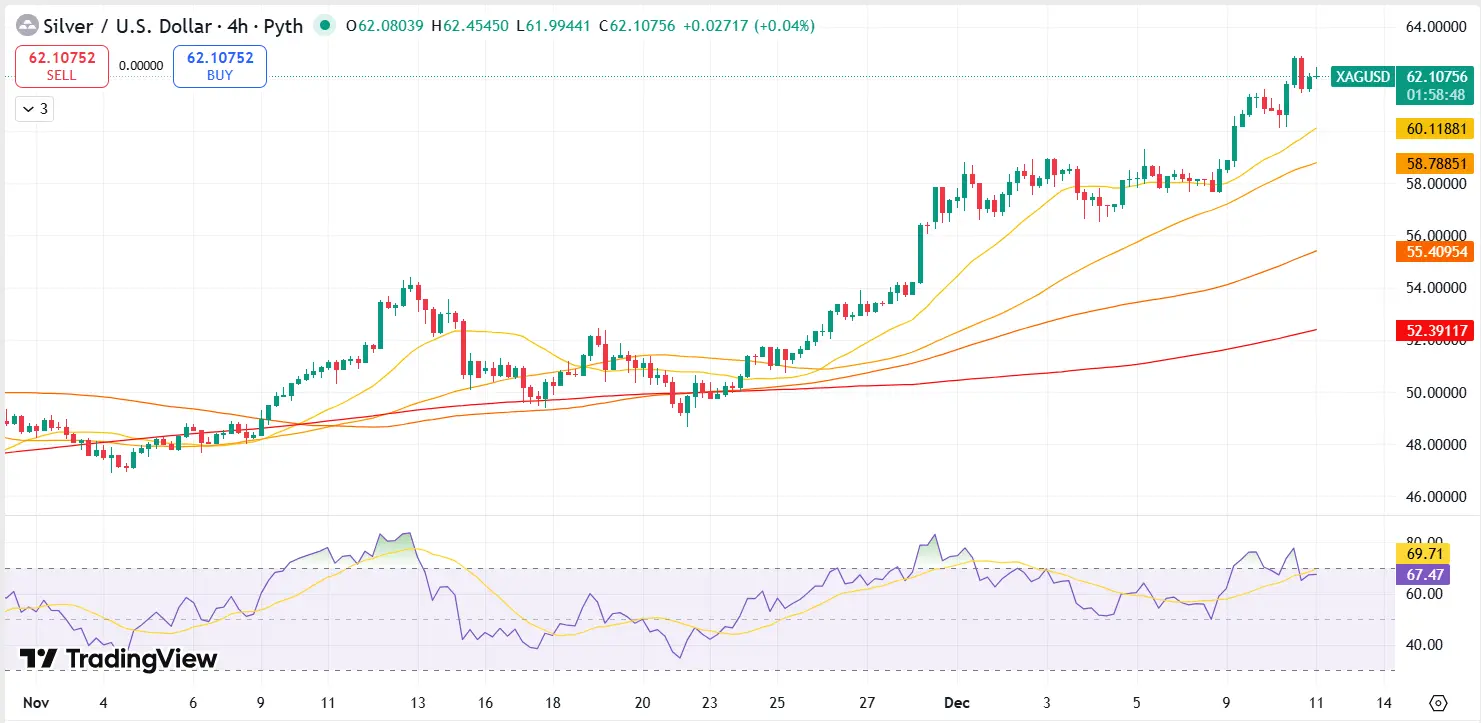
As of December 11, 2025, Spot Silver (XAG/USD) is consolidating near its all-time high, having recently surpassed the psychological $60.00 and $62.00 marks. Our analysis focuses on a four-hour and daily chart perspective to identify the critical support and resistance zones that traders in the Dubai silver market should monitor closely.
Immediate Resistance Levels (The Targets)
| Level | Significance | Technical Interpretation |
|---|---|---|
| R1: $63.85 - $64.00 | Short-Term Fibonacci Extension / Psychological Mark | The next key hurdle. A break here would confirm the bullish extension following the Fed decision. |
| R2: $65.00 - $65.25 | Major Psychological / Analyst Target | This is the crucial medium-term target for the current momentum wave. Clearing this zone would open the path to aggressive upside. | R3: $68.00 | Next Fibonacci Projection | A clear runway to this level opens if $65.00 is breached and consolidated. |
Critical Support Levels (The Floors)
| Level | Significance | Technical Interpretation |
|---|---|---|
| S1: $62.00 - $61.50 | Immediate Support / Yesterday's Lows | Holding above this level is essential for maintaining the strong immediate bullish momentum. It should attract the first wave of dip-buyers. |
| S2: $60.30 - $60.00 | Psychological Mark / Previous All-Time High | This is the must-hold pivot. A move back below the psychological $60.00 level would signal significant profit-taking and a potential deeper correction. |
| S3: $58.80 - $59.00 | Breakout Point / Monthly Trading Range High | The primary support that defined the recent breakout. A drop to this level would represent a healthy, yet deep, correction and a major buying opportunity. |
Indicator Deep Dive: Bullish Strength with Caution
Relative Strength Index (RSI)
The 4-hour and daily RSI remains deep in overbought territory (readings above 70).
- Interpretation: While extended, the market’s refusal to turn lower despite the high RSI is a classic sign of strong, sustained bullish momentum (momentum over price). However, a bearish divergence is visible on the 4-hour chart, where price is making new highs, but the RSI is failing to follow suit. This is a warning sign of potential short-term exhaustion, suggesting that aggressive new long positions should be delayed until a clear consolidation or minor pullback occurs.
Moving Averages (MAs)
The short-term (10-day), medium-term (50-day), and long-term (200-day) Exponential Moving Averages (EMAs) are all steeply sloped upwards and perfectly aligned in a strong bullish trend formation.
- Interpretation: The price is trading significantly above all major moving averages, a textbook signal of a powerful uptrend. The 10-day EMA acts as dynamic, immediate support and is a key benchmark for short-term traders.
Silver Price Forecast: The Path Ahead
The dominant trend for XAG/USD remains unequivocally Bullish on daily and weekly charts. The confluence of lower-for-longer US interest rates, intense industrial demand, and low inventories creates a compelling narrative for continued appreciation.
- Base Case (70% Probability): Following the initial Fed-induced spike, silver undergoes a brief bullish consolidation phase near the $62.00 - $63.00 level for a few days. Dip-buyers, spurred by the long-term fundamentals and the technical breakout, step in at the $61.50 or $60.00 support zones. The market then successfully tests and breaches the $65.00 level before the end of December, setting up a target of $68.00 in early 2026.
- Bear Case (30% Probability): The overbought technicals trigger a sharp profit-taking sell-off, possibly exacerbated by unexpected hawkish commentary from a Fed official or a sudden USD rebound. Price breaks convincingly below the critical $60.00 psychological support. This could lead to a deeper correction toward the $58.80 (S3) pivot point, which would be a high-conviction buying zone for long-term investors. A sustained move below $57.00 would negate the immediate bullish structure.
Conclusion for Gold Trade, Dubai Clients
The silver market is not just rallying; it is undergoing a structural revaluation driven by its dual role as a precious and an industrial metal. The technical indicators confirm the immense strength of this move, but also flash a temporary caution signal due to the overbought readings.
For investors in Dubai seeking exposure to this powerful trend, a prudent strategy involves:
- Defensive Trading: Wait for a confirmed, minor pullback to the $61.50 - $60.00 support zone before initiating new long positions, allowing the short-term RSI to reset.
- Long-Term Positioning: For long-term portfolios, the $58.80-$60.00 range represents a highly attractive area to accumulate physical silver, capitalizing on the metal’s unique position in the global economy.
Gold Trade, Dubai, maintains a strong long-term bullish outlook for silver. The targets remain firmly set on the next major psychological milestone: $65.00 and beyond.
Disclaimer: This report is for informational purposes only and is not investment advice. Trading and investing in precious metals carries risk, and users should consult a qualified financial advisor before making any investment decisions.
« Back to News & Reports List