January 12, 2026
Gold Technical Analysis Report – 12 Jan 2026: XAU/USD Targets $4,700 Amid Global Volatility
Explore the comprehensive Gold Technical Analysis Report for 12 Jan 2026. Gold Trade, Dubai, breaks down the XAU/USD surge to $4,600, key support/resistance levels, and the impact of the "Venezuela Shock" on UAE retail gold prices.
The Historic Surge: Gold Smashes Through $4,600
The global bullion market has entered a new era of price discovery as of Monday, January 12, 2026. In a breathtaking start to the second full trading week of the year, spot gold (XAU/USD) has successfully dismantled the psychological and technical barrier of $4,550, hitting an intraday high of $4,602.40.
For investors at Gold Trade, this milestone represents more than just a numerical record; it is a confirmation of the long-term structural bull market we forecasted in late 2025. As Dubai’s retail 24K gold price crosses the AED 550 per gram mark, the "City of Gold" is seeing unprecedented activity from both institutional hedgers and retail buyers seeking refuge from a devaluating US Dollar and intensifying geopolitical friction.
Fundamental Catalysts: Why Gold is Rallying Today
Before diving into the technical charts, it is essential to understand the "perfect storm" driving today’s price action. Our analysts identify three primary drivers:
- The "Venezuela Shock" & Geopolitical Risk: Escalating territorial disputes in South America, coupled with leadership fractures in key oil-producing regions, have spiked the "fear premium." Gold remains the ultimate "safe haven" during such supply-side shocks.
- Federal Reserve Autonomy Concerns: Market whispers regarding the potential erosion of US Federal Reserve independence have pressured the US Dollar Index (DXY) , which recently dipped toward the 102.50 level. A weaker dollar makes gold significantly cheaper for international buyers using the AED or Euro.
- Central Bank Accumulation: Data from the first week of 2026 confirms that emerging market central banks—led by China, Turkey, and India—have continued their aggressive diversification strategy, absorbing nearly 195 tonnes in the last quarter alone.
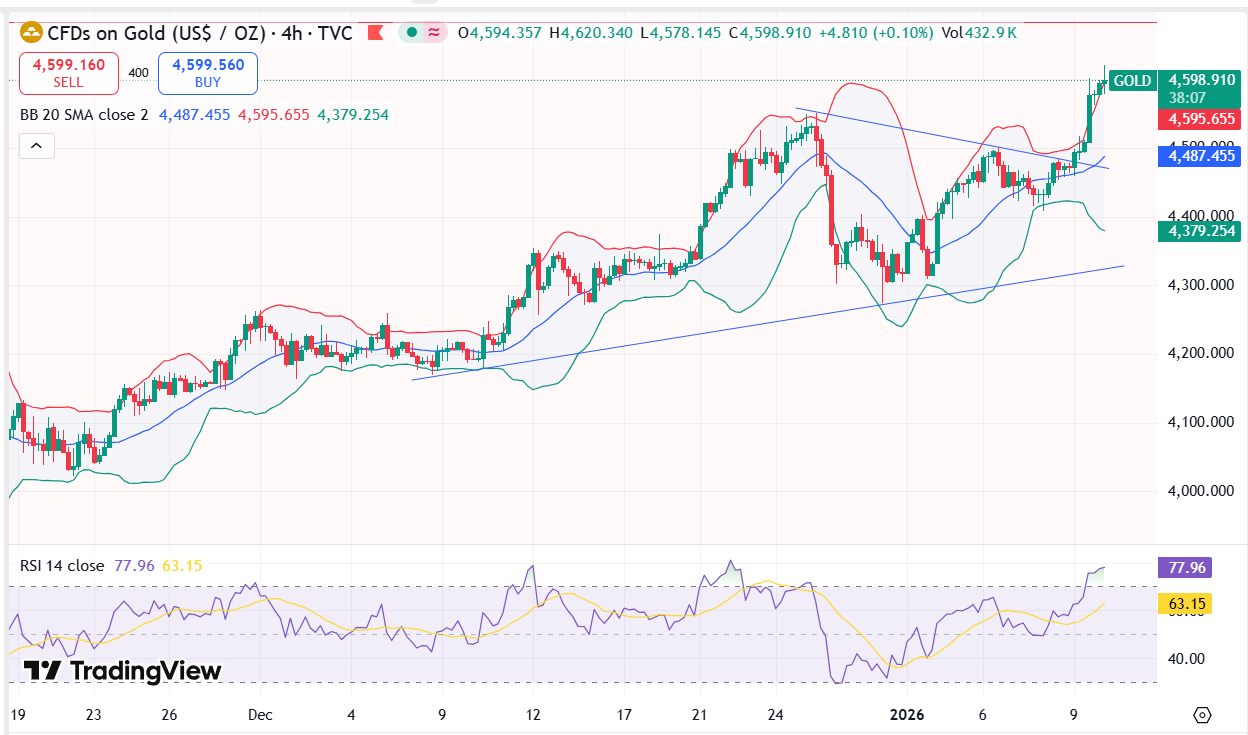
Technical Analysis: Breaking Down the XAU/USD Chart
From a technical perspective, the Gold Technical Analysis Report - 12 Jan 2026 reveals a market that is "overbought" but not yet "exhausted."
1. Moving Averages: The Golden Foundation
Gold is currently trading well above its 50-day Exponential Moving Average (EMA) of $4,415 and its 200-day Simple Moving Average (SMA) of $4,325. This alignment, often referred to as a sustained "Golden Cross" environment, suggests that the long-term trend is firmly intact. Any pullbacks to the 21-day SMA (currently at $4,480) are being aggressively bought by "buy-the-dip" institutional players.
2. Momentum Indicators: RSI and MACD
- Relative Strength Index (RSI): The 14-day RSI is currently hovering at 68.5. While this is nearing the "overbought" threshold of 70, the lack of bearish divergence suggests that the current momentum has enough "fuel" to test the $4,650 extension before a meaningful correction.
- MACD (Moving Average Convergence Divergence): The MACD histogram shows expanding bullish bars above the signal line. This indicates that the buying pressure is accelerating, rather than slowing down.
3. Fibonacci Extensions
Using the swing low of November 2025 to the December 2025 high, the 161.8% Fibonacci extension aligns perfectly with the $4,712 mark. This is our primary target for the remainder of Q1 2026.
Key Technical Levels to Watch
For traders and investors at Gold Trade, the following table outlines the critical pivot points for the current session:
| Level Type | Price (USD/oz) | Significance |
|---|---|---|
| Resistance 3 | $4,750 | Ultimate Q1 Target / Trend Exhaustion |
| Resistance 2 | $4,712 | 161.8% Fibonacci Extension |
| Resistance 1 | $4,635 | Immediate High-Volume Node |
| Current Price | $4,602 | Pivot Zone / New Support |
| Support 1 | $4,550 | Previous Resistance / Strong Floor |
| Support 2 | $4,480 | 21-day SMA / Psychological Support |
| Support 3 | $4,415 | 50-day EMA / Major Trend Lifeline |
Local Impact: Dubai Gold Price Update (12 Jan 2026)
The surge in international spot prices has directly impacted the local UAE market. For our clients in the UAE, the Gold Trade retail desk reports the following rates as of 10:00 AM GST:
- 24K Gold: AED 550.50 per gram
- 22K Gold: AED 510.25 per gram
- 21K Gold: AED 488.50 per gram
- 18K Gold: AED 419.75 per gram
Despite these record-high prices, Dubai continues to maintain its competitive edge due to the absence of GST/VAT on investment-grade bars, making it the preferred destination for global wealth preservation.
Quantitative Insight: The Pivot Point Formula
To provide a more granular look for our professional day-traders, we utilize the standard Floor Pivot Point calculation to determine the daily bias.
If we consider the previous session's high ($4,580), low ($4,490), and close ($4,560), the Central Pivot Point ($P$) is calculated as:
P = (High + Low + Close)/3 = (4580 + 4490 + 4560)/3 = 4543.33
Since the current price ($4,602) is trading well above $4543.33$, the market sentiment for 12 Jan 2026 is classified as Strongly Bullish.
Investment Strategy: How to Position Your Portfolio
At Gold Trade, we recommend a balanced approach during this period of price discovery:
For Long-Term Investors
Do not wait for a "deep" correction that may never come. With central banks continuing to buy, the downside is limited. We recommend "Dollar Cost Averaging" (DCA) into physical 24K bars. Even at $4,600, gold remains under-owned relative to global debt levels.
For Short-Term Traders
Look for intraday long entries on a retest of the $4,550 support level. Set your stop-loss just below $4,520 to protect against "flash" profit-taking. Your primary take-profit target should be scaled between $4,650 and $4,700.
For Hedgers
Given the volatility in the USD/AED peg's parent currency (USD), locking in gold prices via futures or forward contracts is a prudent move for jewelry manufacturers and industrial users in Dubai.
Conclusion: The Path to $5,000
The Gold Technical Analysis Report - 12 Jan 2026 concludes that the path of least resistance remains to the upside. While short-term "coiling" or consolidation between $4,550 and $4,600 is healthy, the underlying fundamentals—geopolitical instability, central bank demand, and technical momentum—all point toward a challenge of the $5,000 psychological barrier by late 2026.
Gold is not just a commodity today; it is a global currency of last resort. As the world navigates the uncertainties of 2026, Gold Trade remains your committed partner in securing your financial future.
Disclaimer: The information provided in this Gold Technical Analysis Report is for educational purposes only and does not constitute financial advice. Trading gold and precious metals involves significant risk. Investors should conduct their own research or consult with a professional financial advisor before making any investment decisions.
« Back to News & Reports List