October 14, 2025
For Gold Trade, Dubai: Your Trusted Partner in Precious Metals Investment
Executive Summary: The Bull Run Sustained Above $4150
The relentless, structurally driven bull run in the gold market (XAU/USD) has catapulted the precious metal to an unprecedented trading range, climaxing recently with a touch of the psychological $4150 Gold Price level. As of the market open on October 14, 2025, the overarching technical posture remains emphatically bullish across all major timeframes (Daily, Weekly, and Monthly). However, the intensity of the recent surge, driven by sustained geopolitical uncertainty, central bank diversification, and a structurally weakened US Dollar (DXY), necessitates caution.
Our detailed Gold Technical Analysis reveals a market currently consolidating just beneath the all-time high, setting the stage for either a final climactic push toward the next major Fibonacci extension at $4300, or a healthy, short-term corrective pullback towards key psychological support at $4050. For sophisticated investors and commodity trading firms like Gold Trade, Dubai, this juncture demands meticulous chart analysis and a disciplined approach to risk management.
1. Macro-Technical Landscape: The Multi-Year Rally
The long-term chart analysis confirms that XAU/USD remains firmly anchored in a historic uptrend. The $4150 Gold Price represents a parabolic extension of the multi-year rally that began in late 2022.
1.1. Trend Direction and Momentum
- Weekly & Monthly Trend: Strongly Bullish. The price action continues to print a sequence of clear higher highs and higher lows, the textbook definition of a structural bull market.
- Daily Trend: Short-Term Consolidation. After hitting $4150, momentum appears to have slightly decelerated, forming a tight trading range, which is indicative of profit-taking by short-term traders but also accumulation by larger institutional players (smart money) around the $4100 zone.
1.2. Key Moving Averages (MA) Crossovers
The critical Moving Averages continue to provide robust support, confirming the depth of the current trend:
- 50-Day Exponential Moving Average (EMA): Currently located near $3920. The distance between the current price and the 50-day EMA signifies extreme strength, although it also suggests an extended market susceptible to a quick, sharp correction.
- 200-Day Simple Moving Average (SMA): Positioned around $3650. The 200-day SMA serves as the ultimate long-term baseline for the Gold Price Prediction, reinforcing the long-term bullish outlook.
2. Critical Gold Support and Resistance Levels (The $4150 Crucible)
Identifying the exact levels of supply and demand is paramount for successful Commodity Trading at these extended highs.
| Level Type | Price (XAU/USD) | Significance for Gold Trade Dubai Clients |
|---|---|---|
| Primary Resistance (Target 1) | $4300 | The next major Fibonacci Extension target (161.8% of a previous swing). A decisive break of this level opens the door to $4500. |
| Immediate Resistance (Crucible) | $4150 - $4175 | The recent high and psychological barrier. Bulls must establish a clear daily close above $4150 to validate the next leg up. |
| Immediate Support (Buy-the-Dip Zone) | $4050 | The crucial psychological and short-term swing-low support. A strong area for a low-risk/high-reward entry. |
| Strong Structural Support | $3980 - $4000 | The key psychological $4000 mark. A failure to hold this level would signal a deeper correction. |
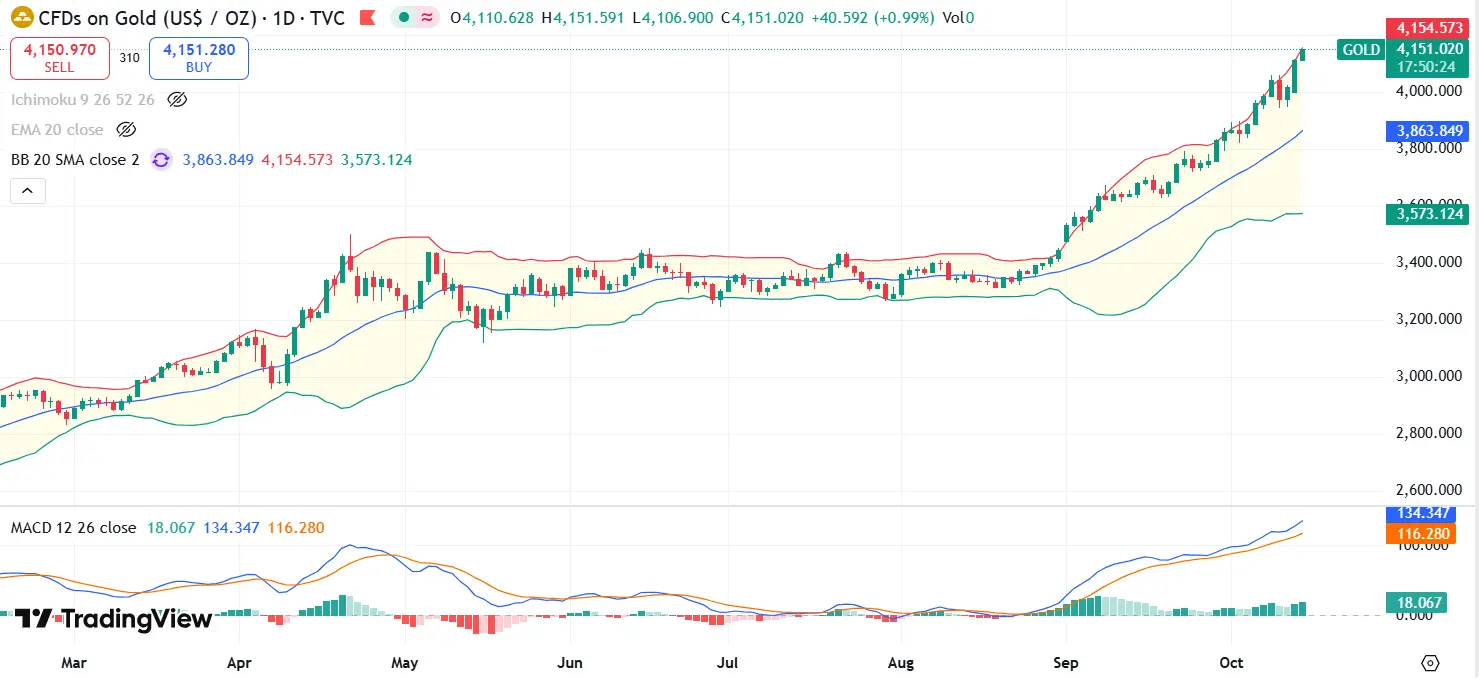
[Chart Placeholder: XAU/USD Daily Chart with MAs, Support/Resistance lines]
3. Oscillator and Indicator Analysis for XAU/USD
While the price action is bullish, a look at momentum indicators reveals classic signs of 'uptrend exhaustion' that frequently precede a healthy correction or consolidation.
3.1. Relative Strength Index (RSI)
- Daily RSI (14): Trading near 75. While still elevated, the RSI has recently dropped out of the extreme overbought territory (above 80) without a significant price drop.
- Actionable Signal: Any divergence (lower RSI peak coinciding with a higher price peak) would be a strong contrarian sell signal, but such a pattern is not yet fully confirmed.
3.2. Moving Average Convergence Divergence (MACD)
The MACD line remains above the signal line, confirming the bullish bias. However, the histogram bars are starting to shorten, reflecting the slight loss of acceleration since the $4150 peak. This is a subtle warning of potential market fatigue.
4. Chart Patterns and Fibonacci Retracement Study
The current structure points towards a classic continuation pattern after a dramatic breakout.
4.1. The Bullish Flag Pattern
On the 4-hour chart, Gold appears to be forming a tight, horizontal consolidation pattern (a mini-rectangle or 'flag') right under the $4150 resistance. This is a high-probability continuation pattern.
- Breakout Confirmation: A 4-hour candle close above $4155 would confirm the flag breakout, projecting an initial target near $4230.
- Invalidation Point: A decisive break below the flag support at $4080 would invalidate the immediate bullish pattern, leading to a test of $4050.
4.2. Fibonacci Retracement of Recent Swing
Applying the Fibonacci retracement tool to the most recent significant swing (low near $3980 to the high at $4150) provides precision entry points for a correction:
- 50% Retracement: $4065 - Coincides perfectly with the immediate support.
- 61.8% Retracement (The Golden Pocket): $4044 - A critical entry point for long-term investors aiming to buy-the-dip before the potential push to $4300.
5. Conclusion and Strategic Trading Plan for Gold Trade
The structural tailwinds supporting the Gold Price remain overwhelmingly intact, driven by the shift towards de-dollarization and unprecedented central bank demand. The recent surge to $4150 is more of a consolidation phase than a reversal setup.
Trade Bias: Bullish with a Strong Caveat for Overbought Conditions
Long-Term (Investors): The outlook remains strongly bullish. Use any dips toward the $4050 - $4000 zone as opportunities to increase core holdings. The multi-year target of $4500 remains highly plausible.
Short-Term (Traders): A patient approach is required.
| Scenario | Trigger Price | Target Price (Take Profit) | Stop Loss (Risk Management) |
|---|---|---|---|
| Bullish Continuation (Breakout) | $4155 (Daily Close) | $4230 (Target 1) then $4300 (Target 2) | $4080 (Flag Invalidation) |
| Bearish Correction (Pullback) | $4080 (4H Close Below) | $4044 (61.8% Fib) then $4000 (Psychological) | $4155 (Resistance Retest Failure) |
Disclaimer: This Gold Technical Analysis Report - 14 Oct 2025 is provided by Gold Trade, Dubai for informational and educational purposes only. It is not investment advice. Clients are strongly encouraged to consult with a licensed financial advisor before making any investment decisions, as the highly volatile nature of the precious metals market carries significant risk. Past performance is not indicative of future results. All trading decisions based on this Gold Price Prediction are made at the sole discretion of the user.
« Back to News & Reports List