October 29, 2025
Gold Technical Analysis Report: Navigating the Correction Ahead of FOMC (29 Oct 2025)
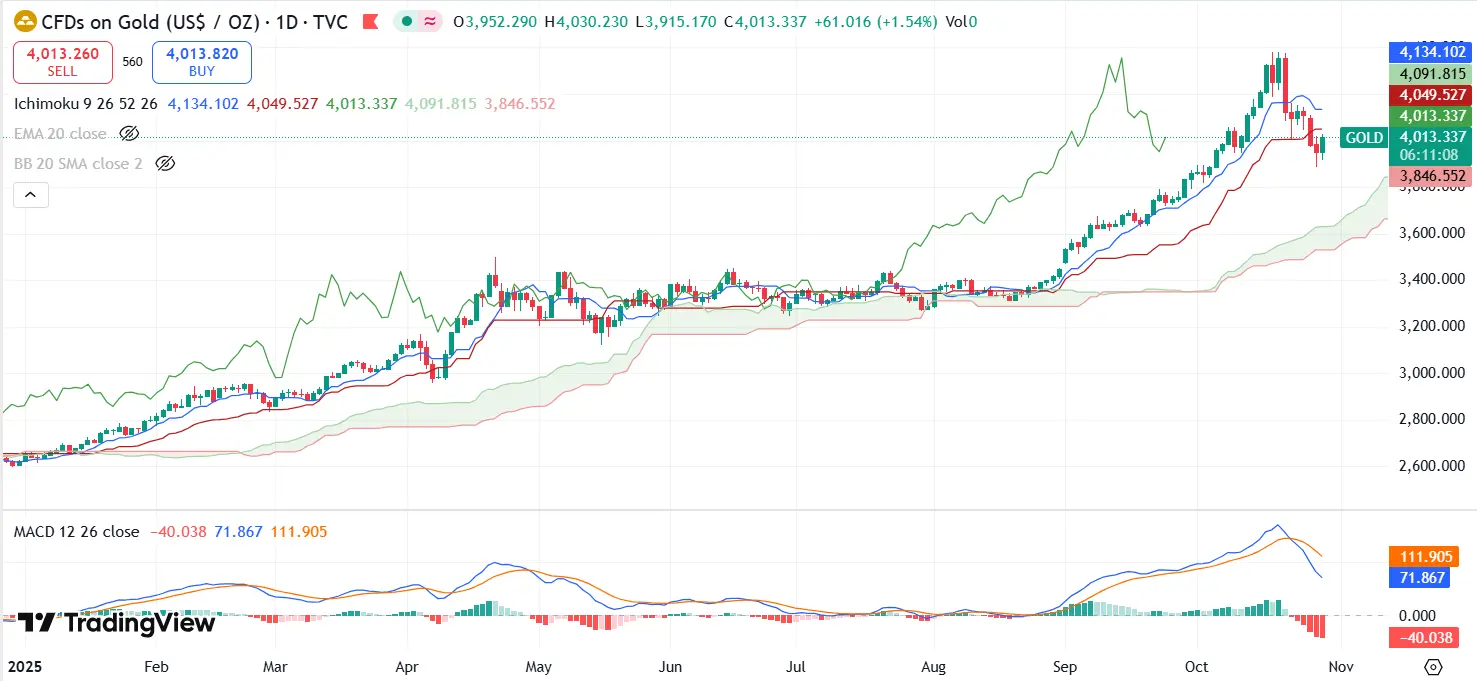
Gold Trade, Dubai—The global gold market, a vital focus for investors and traders in the UAE and the wider Middle East, finds itself at a critical juncture. After a historic, parabolic rally that propelled XAU/USD to unprecedented highs near $4,400 per ounce, the metal is currently undergoing a sharp, yet anticipated, technical correction. As of October 29, 2025, the market is exhibiting classic signs of consolidation, with key technical support levels under intense scrutiny, particularly in the lead-up to today's critical Federal Open Market Committee (FOMC) interest rate decision.
This exclusive analysis from Gold Trade, Dubai, provides a deep dive into the technical indicators, price action, and the prevailing market structure to offer a clear Gold price prediction and strategic outlook for the days and weeks ahead.
The Anatomy of the Correction: A Look at Price Action
The recent pullback, which saw gold retreat from its peak, is viewed by most technical analysts as a healthy and necessary phase following an extraordinary upward momentum. The correction’s speed, however, has been notable, drawing attention to two key factors:
- Overbought Extremes: The rally had pushed the Relative Strength Index (RSI) to multi-year extremes, with the weekly chart registering readings that screamed overbought conditions. Such extremes rarely sustain without a cooling-off period.
- Trade Optimism: Progress in US-China trade negotiations has tempered the demand for safe-haven assets like gold, prompting profit-taking among short-term speculators who had pushed the price to its maximum extension.
The psychological and technical support at the $4,000 mark has failed to hold, confirming the depth of the current correctional wave. Traders are now closely monitoring lower-bound support zones to identify the potential floor for this retracement.
Key Technical Levels: Support and Resistance Mapping
Identifying crucial price levels is paramount for traders in the Dubai gold market. These benchmarks guide decision-making and signal potential trend reversals or continuations.
| Level Type | Price (XAU/USD) | Significance |
|---|---|---|
| Immediate Resistance | $4,041 - $4,070 | Coincides with the 20-period Simple Moving Average (SMA) and the recent pivot highs. Clearing this is vital for a bullish recovery. |
| Psychological Barrier | $4,000 | A major round number that, after being broken, now acts as a strong short-term resistance. |
| Immediate Support | $3,937 - $3,950 | The current primary technical floor. Holds firm against deeper selling pressure. |
| Key Fibonacci Support | $3,872 | The 38.2% Fibonacci Retracement level of the larger bull run (approx. $3,350 to $4,400). A critical level for the Wave 2 correction. |
| Deep Support/Invalidation | $3,748 | The 61.8% Fibonacci Retracement (Golden Ratio) and the line-in-the-sand for the overall bullish structure. |
The Moving Average Convergence Divergence (MACD) oscillator is currently signaling a prevailing sell-side momentum on the daily chart, reinforcing the bearish short-term bias. For bulls to regain confidence, the price must decisively recapture the $4,000 handle and establish a sustainable floor above the $3,950-$3,937 support corridor.
Elliott Wave Analysis: Positioning for the Next Impulsive Move
From an Elliott Wave perspective, the price action over the last two years suggests gold is in the midst of a larger, long-term bull market cycle.
- Wave 1 (Completed): The extraordinary rally from approximately $3,350 to the $4,400 peak is considered the first major impulse wave.
- Wave 2 (Current Phase): The current sharp sell-off is likely the corrective Wave 2. This phase is characterized by a retracement that typically falls between the 38.2% and 61.8% Fibonacci levels of Wave 1. The current test of the $3,872 (38.2% Fibo) level aligns perfectly with this corrective structure.
- Wave 3 (Anticipated): If the $3,748 support holds, the subsequent move—the powerful and typically longest Wave 3—is projected to carry gold prices well beyond the $4,400 record high. This is the stage that long-term gold investors in Dubai are patiently awaiting.
This framework suggests the current correction, while sharp, is a necessary foundation for the next significant upward expansion.
Fundamental Headwinds: The FOMC Rate Decision and Trade Talks
Today’s focus is undeniably on the FOMC’s interest rate decision. While a 25-basis-point rate cut is widely anticipated and largely priced in, the real market driver will be the accompanying statement and the press conference by Chairman Jerome Powell.
- Dovish Signal: A significantly more dovish tone than expected could immediately weaken the US Dollar (USD) and U.S. Treasury yields, providing the necessary catalyst for gold to reverse its downtrend and aim to retest the $4,000 level. This is the bulls' preferred scenario.
- Neutral/Hawkish Signal: Any hint of pausing the easing cycle, or a less dovish statement, could strengthen the USD and expose gold to a deeper sell-off, potentially targeting the crucial $3,872 support.
Furthermore, easing tensions in the US-China trade dispute continue to undermine gold's role as a global safe haven. Continued positive headlines in the coming days could prolong the consolidation phase, making the Fed decision even more pivotal for short-term direction.
Strategic Outlook for Gold Investors
For our clients at Gold Trade, Dubai, the current technical picture presents an opportunity for strategic accumulation rather than panic selling. The long-term fundamentals—driven by central bank gold purchases, global financial uncertainty, and the "debasement trade"—remain robust.
- Short-Term Traders: Must remain nimble, using the $3,937-$3,950 range as a critical gauge. A confirmed breakdown could signal a swift move towards the $3,872 Fibonacci level.
- Long-Term Investors: The current retracement offers a potential re-entry or averaging opportunity. Accumulation on dips toward $3,872 and below, should it occur, aligns with the anticipated Wave 3 scenario.
Disclaimer: This Gold Technical Analysis Report is for informational purposes only and does not constitute financial advice. All investment and trading decisions carry risk. Always consult with a qualified financial advisor.
« Back to News & Reports List