November 22, 2025
Weekly Gold Technical Analysis Report (24-28 Nov 2025): XAU/USD Stabilizes After Plunge, Defending Critical $4,050 Support
Providing the Strategic Gold Price Forecast for the Upcoming Trading Week. Exclusively from Gold Trade, Dubai.
Executive Summary: The Battle for $4,050
The Gold Market saw a violent price correction last week, shattering immediate support levels and sending XAU/USD towards the critical psychological barrier of $4,000 per ounce. As we enter the trading week of 24-28 November 2025, the metal is finding temporary stabilization, last seen closing near the $4,066 mark. This report confirms that the crucial technical battleground for the week is the $4,050–$4,150 range. A sustained hold above $4,050 is mandatory to prevent a deeper slide, while a successful breach of $4,150 could validate a healthy rebound toward $4,200. Investors looking at Gold Investment and Wealth Preservation must pay close attention to the structural integrity of this low-end consolidation. The focus of this Weekly Gold Technical Analysis Report is to map out the high-probability scenarios and key trigger levels for our esteemed clients at Gold Trade, Dubai.
Section I: Macro-Economic Drivers – Navigating the Rate Hike Uncertainty
The narrative driving the recent sell-off remains firmly rooted in the resurgence of the U.S. Dollar (DXY) and global central banks adopting a surprisingly hawkish posture. The previous high of Gold was fueled by expectations of imminent rate cuts, which have been rapidly recalibrated following robust economic data releases. This forced market participants to unwind long positions, resulting in the sharpest correction Gold has seen in months. The absence of major Tier-1 economic data releases this week might temporarily reduce volatility, allowing technical factors to gain prominence.
However, geopolitical tensions, particularly those concerning the Middle East, continue to offer a persistent, underlying bid for physical gold and other safe-haven assets. This fundamental floor is likely what prevented a catastrophic break below the $4,000 mark. The short-term pain is a reaction to interest rate expectations, while the long-term value remains secured by systemic risk and sovereign debt concerns. For investors in the Dubai Gold Market, these dips often represent attractive entry points for long-term strategic accumulation, capitalizing on the temporary technical dislocation.
Section II: XAU/USD Price Action and The 200-Day Moving Average Test
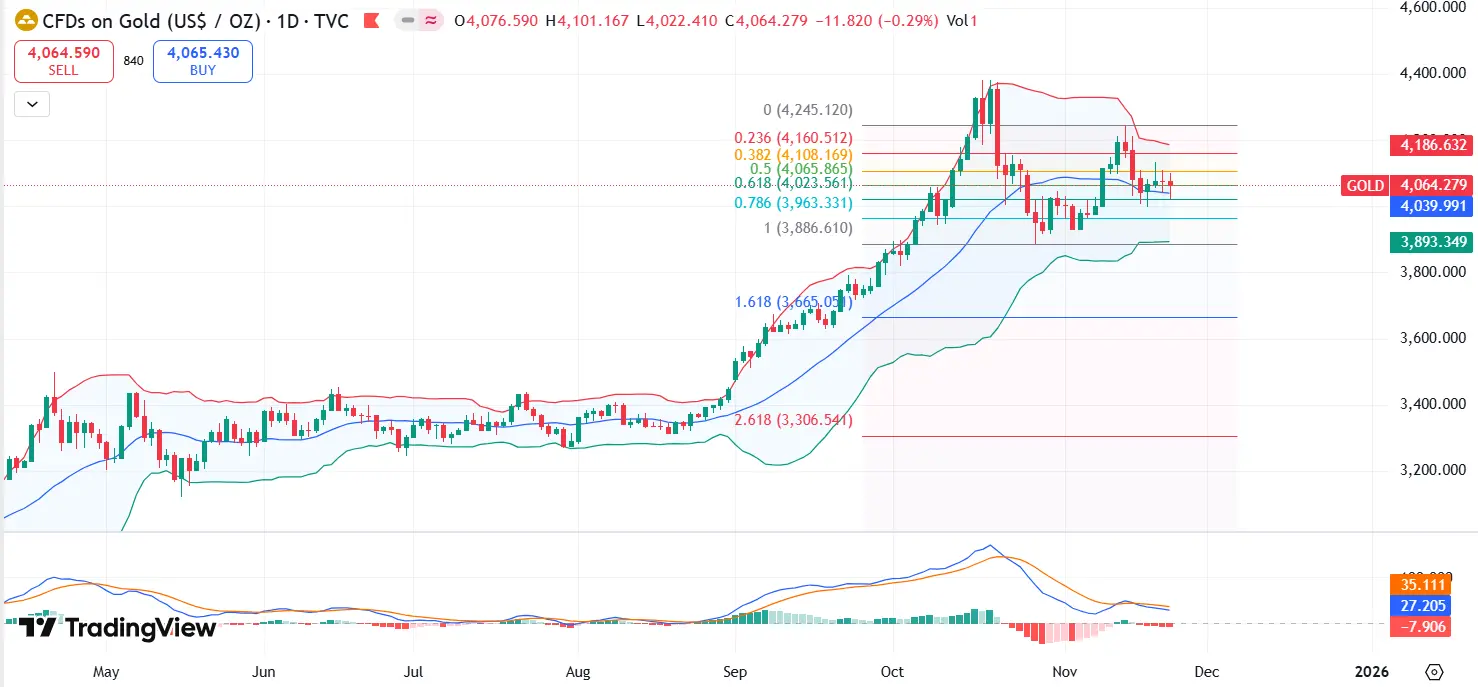
Last week's price action was dominated by volatility, but the market found a temporary bottom close to the 50% Fibonacci retracement level of the larger Q4 rally, which aligns perfectly with the crucial $4,050 support. This level is also closely shadowed by the widely watched 200-day Simple Moving Average (SMA), which typically acts as a major line of demarcation between long-term bullish and bearish trends.
The failure to recover immediately above the $4,150 (the previous support) confirms the shift in short-term market momentum. The current price of XAU/USD around $4,066 suggests that the bears have taken a brief pause, likely waiting for confirmation on whether the $4,050 support can sustain the pressure. Traders should look for daily candlestick closes. A strong green candle closing near $4,100 would signal bullish interest has returned, whereas any close below $4,050 would expose the $4,000 psychological level to heavy scrutiny. This is the 'make or break' zone for the next phase of the rally.
The $4,050 price point must hold to prevent further decline. This is the crucial line for the Gold Price Forecast this week.
Section III: Momentum Diagnostics – Oversold RSI Signals Rebound Potential
Technical indicators provide a clearer picture of the selling exhaustion. The Relative Strength Index (RSI) on the daily chart plunged deep into the oversold zone (below 30) during the low point of the correction. While the RSI has since pulled back slightly towards the 35 mark (suggesting some initial buying), the condition remains deeply bearish from a price standpoint, yet historically conducive to a technical counter-rally.
This divergence—where the price has plummeted but the momentum indicator signals extreme stress—suggests that the intensity of the selling pressure is waning. A quick, sharp rebound is possible if volume materializes. However, the MACD (Moving Average Convergence Divergence) indicator remains a strong cautionary signal. The MACD histogram is printing significantly negative bars, confirming that the current momentum is dominated by bears on the medium-term timeframe. We require the MACD lines to converge or cross above the signal line before confirming a durable bottom. Until then, tactical trades must be managed with extremely tight stop-losses. This indicator snapshot is vital for short-term Gold Trade Dubai trading decisions.
Section IV: Key Levels and Strategic Outlook (24-28 Nov 2025)
Successful trading in this environment hinges on recognizing and reacting to the key trigger levels. Our Gold Technical Analysis identifies the following zones as most critical for the upcoming week:
| Level Type | Price ($/oz) | Strategic Significance & Scenario |
|---|---|---|
| Primary Resistance (R1) | $4,150 | Immediate hurdle. Clearing this (R1) reverses short-term bearish sentiment and opens the path to R2. |
| Major Resistance (R2) | $4,200 | Strong resistance confluence (prior high swing/61.8% Fibo). Necessary to re-establish intermediate bullish trend. |
| Current Zone | $4,060 - $4,080 | Consolidation area, signaling market uncertainty and accumulation/distribution efforts. |
| Primary Support (S1) | $4,050 | Crucial line of defense, 50% Fibo, and 200-day SMA proximity. Must hold. |
| Psychological Support (S2) | $4,000 | The ultimate red line. A sustained break below S2 confirms a deeper structural correction toward $3,900. |
Scenarios for the Week Ahead:
- Bullish Scenario: A clean breakout and daily close above $4,150 (R1) confirms the previous sell-off was merely an exhaustion flush. This opens the door to challenge $4,200.
- Consolidation Scenario: Price remains trapped between $4,050 (S1) and $4,150 (R1). This suggests a period of quiet accumulation before the next major move.
- Bearish Scenario: A decisive break and close below $4,000 (S2). This would validate the bearish correction and set targets towards the $3,900 level, requiring immediate risk reduction.
Section V: The Gold Trade, Dubai Investment Strategy: Leveraging Volatility for Wealth Preservation
For our clientele in the Dubai Gold Market, this market correction presents a classic two-fold opportunity. Firstly, the technical rebound potential suggests high-risk, high-reward tactical long entries can be managed near the $4,050 support, using the $4,000 level as the definitive stop. Secondly, and more crucially for our foundation in Wealth Preservation, the discounted prices of $4,066 represent a compelling entry point for long-term physical acquisition.
We advocate for accumulating 24K physical gold during this period of price weakness. The long-term fundamental drivers—geopolitical instability, global debt saturation, and continued erosion of fiat currency purchasing power—remain robustly supportive of higher gold prices. While the short-term technical picture is volatile, patient investors who acquire physical assets at these psychologically important support zones are best positioned to capitalize on the next structural uptrend. Gold Trade, Dubai remains committed to providing real-time, actionable insights to guide your investment journey through both volatile corrections and sustained rallies.
Gold Trade, Dubai advises maintaining strong liquidity and prioritizing risk management this week. Let the $4,050 level be your guide.
IMPORTANT FINANCIAL DISCLAIMER
This Weekly Gold Technical Analysis Report is for informational purposes only and is not tailored to your specific investment objectives, financial situation, or needs. It should not be considered personalized investment advice or a solicitation to buy or sell any financial instrument. Trading XAU/USD and other precious metals involves substantial risk of loss, including the potential loss of principal. The price volatility in the Dubai Gold Market is significant. All decisions regarding Gold Investment and Wealth Preservation must be based on your independent research and consultation with a qualified financial advisor. Past performance is not an indication of future results. Gold Trade, Dubai, and its analysts accept no liability for any losses resulting from the use of this report.
« Back to News & Reports List