December 10, 2025
Gold Technical Analysis Report: The Fed Factor and the $4,300 Breakout Target (December 10, 2025)
For Gold Trade, Dubai Clients: Navigating Volatility Ahead of the FOMC Decision
Executive Summary: Bullish Bias Intact, Consolidation Before the Storm
Today’s session, December 10, 2025, sees the price of spot gold (XAU/USD) in a state of high-altitude consolidation, trading narrowly within a well-defined range. The market is holding its breath, positioned just below the recent all-time highs, as it awaits the highly anticipated Federal Open Market Committee (FOMC) interest rate decision.
Our Gold Technical Analysis for Gold Trade, Dubai, confirms that the underlying, multi-month bullish trend remains robust. The yellow metal is exhibiting classic "coiling" behaviour, indicative of a build-up in pressure that typically precedes a major breakout. The confluence of a widely expected Fed rate cut and persistent global economic uncertainty provides a strong fundamental tailwind to the metal’s technical strength.
Key Technical Takeaways for 10/12/2025:
| Indicator | Current Signal | Interpretation |
|---|---|---|
| Trend (Daily) | Strong Bullish | Higher Highs & Higher Lows remain unchallenged. |
| Immediate Resistance | $4,245 | Key level for immediate breakout confirmation. |
| Primary Target | $4,300 | Next significant psychological and technical ceiling. |
| Key Support (S1) | $4,180 | Reinforced by the 50-day Exponential Moving Average (EMA). |
| Momentum (RSI) | Neutral/Approaching Overbought (62-65) | Room for further upside exists before a major correction. |
The Looming Catalyst: FOMC and its Impact on Gold Price
The defining event of the day—and the week—is the conclusion of the U.S. Federal Reserve's final monetary policy meeting of 2025. Market consensus overwhelmingly anticipates a 25-basis-point rate cut, a move that has been largely priced into the market over the past few weeks.
Why a Rate Cut Fuels the XAU/USD Rally
A cut in the Fed Funds rate fundamentally weakens the US Dollar and reduces the opportunity cost of holding non-yielding assets like precious metals. For the Gold Price Forecast, the key is not just the cut itself, but the forward guidance from Chairman Jerome Powell regarding 2026.
- Dovish Forward Guidance: A strong indication of multiple, further rate cuts in 2026 would likely trigger a massive, impulsive upward movement, easily surpassing $4,300 and opening the path toward the $4,400 and $4,500 levels.
- "Buy the Rumour, Sell the Fact" Risk: If the Fed's statement is perceived as less dovish than expected—perhaps hinting at a pause after this cut—a short-term profit-taking correction could ensue, driving the price back to test the critical $4,180 support. Gold Trade, Dubai clients should maintain a vigilant stop-loss strategy.
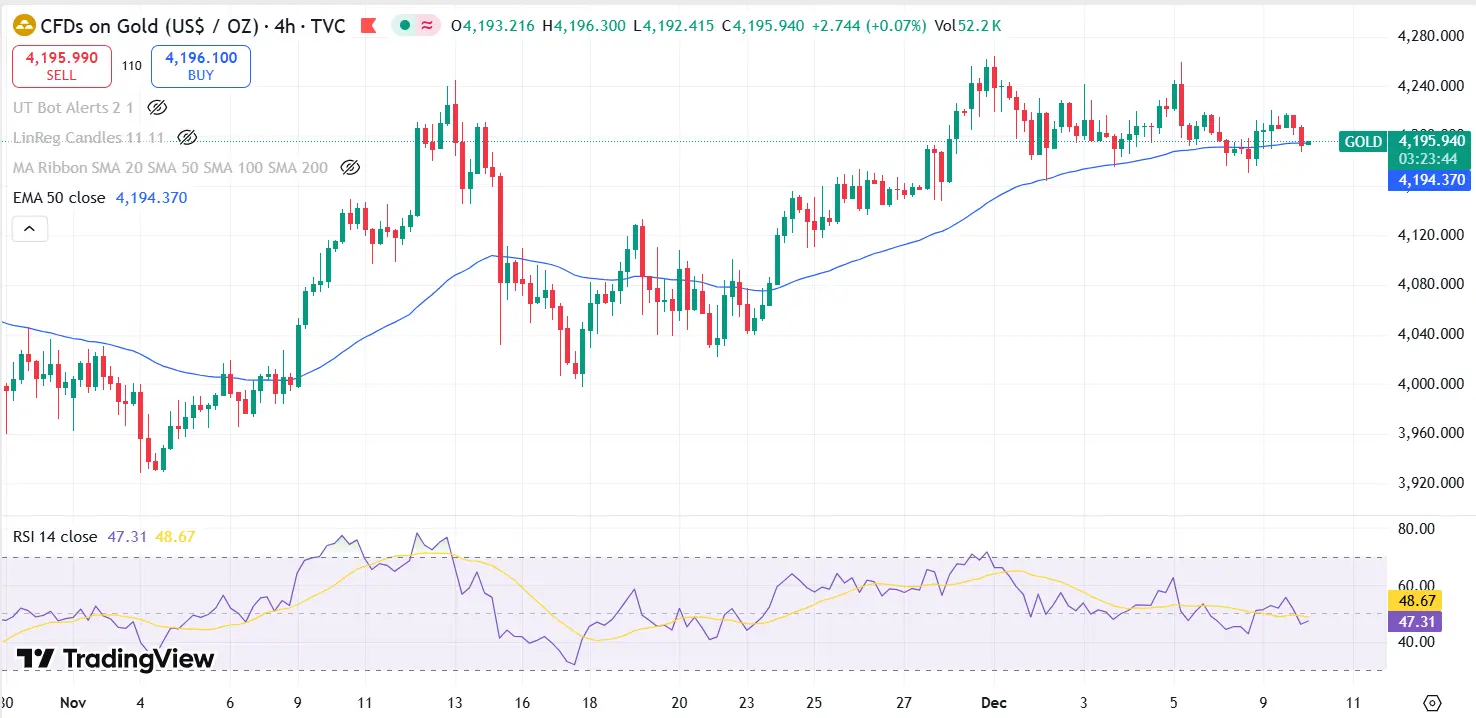
Detailed Technical Analysis (XAU/USD - H4 & Daily Charts)
- Multi-Month Trend Structure and Chart Patterns
The long-term Gold Technical Analysis continues to paint a picture of strength. The price action on the daily chart remains firmly nestled within an Ascending Channel, a textbook sign of a sustained uptrend.
In the shorter term (H4 chart), the market has formed a Symmetrical Triangle Pattern between approximately $4,170 and $4,245. This formation represents a period of indecision and consolidation, with the narrowing range suggesting an imminent, sharp breakout.
- Bullish Breakout Confirmation: A convincing, hourly close above $4,245 will officially break the upper boundary of this triangle, signaling the end of consolidation and the start of the next bullish leg. This is the Buy Gold Dubai high-conviction entry point we are monitoring.
- Bearish Invalidation: A decisive close below $4,180 would invalidate the immediate bullish bias, suggesting a deeper correction towards the structural support at $4,151.
- Key Moving Averages and Indicators
Indicator Current Reading Key Level/Action 50-Day Exponential Moving Average (EMA) approx $4,180 Acts as immediate dynamic support (S1). Relative Strength Index (RSI 14) approx 64 Neutral-to-Bullish, maintaining momentum without being severely overbought. Moving Average Convergence Divergence (MACD) Above Signal Line, Histogram Flattening Confirms bullish momentum, but the recent flattening highlights the current consolidation phase. The fact that the price remains comfortably above the 50-day EMA ($4,180) is a strong technical pillar. The 50-day EMA has consistently served as dynamic support during this extraordinary 2025 rally. Any dip towards this level should be considered a buy-on-dip opportunity, provided the overall bullish structure is maintained.
Strategic Outlook for Gold Trade, Dubai Clients
Our core strategy remains aligned with the predominant, long-term bullish trend. The current consolidation offers a strategic window for investors before the market reacts to the FOMC data.
Recommended Trading Strategy (10 Dec 2025)
- Primary Position: Maintain or initiate Long positions (Buy) with a primary target of the psychological $4,300 level.
- Breakout Entry: A high-probability entry signal is triggered on a confirmed break and close above $4,245.
- Risk Management: A disciplined stop-loss must be placed below the key structural support at $4,150. A breach of this level would signal a significant, trend-threatening correction.
- Conservative Traders: Wait for the Fed's announcement. A pullback towards the $4,180 EMA support post-FOMC, coupled with a rebound confirmation, offers a safer entry point for the long trade.
The Dubai Gold Market Context
The global XAU/USD price directly influences local Dubai Gold Rates. As the international price inches closer to the $4,300 target, local prices for 24-karat gold are expected to follow suit, reinforcing the value proposition for investors and jewellery shoppers in the UAE. The continued strength in the global Precious Metals Outlook makes gold a critical diversification tool for portfolios based in the region.
Conclusion: Positioning for the Post-Fed Rally
The Gold Technical Analysis Report - 10 Dec 2025 highlights a market at a pivotal juncture. The technical indicators are constructive, the price structure is bullish, and the fundamental backdrop—driven by expected rate cuts and ongoing geopolitical uncertainty—is highly supportive.
While short-term volatility is guaranteed around the FOMC announcement, the path of least resistance for XAU/USD remains to the upside. Our focus remains squarely on the $4,245 resistance level, the gateway to the significant $4,300 target.
Are you ready to position your portfolio for the next leg of the gold rally?
Disclaimer: This Gold Technical Analysis is provided by Gold Trade, Dubai, for informational and educational purposes only and does not constitute financial or investment advice. Trading XAU/USD and other Precious Metals involves significant risk. Clients should consult with a professional financial advisor before making any investment decisions and use appropriate risk management tools.
« Back to News & Reports List