December 13, 2025
Gold Technical Analysis Report: Bullish Continuation Expected (15 Dec - 19 Dec 2025)
Positioning for the Next Breakout: Gold Prices Eye Record Highs
DUBAI, UAE – December 14, 2025 – The global gold market (XAU/USD) is heading into the penultimate full trading week of 2025 (December 15th to December 19th) with a distinctly bullish technical outlook. After a period of healthy consolidation following its recent aggressive ascent, the precious metal is showing clear signs of preparing for its next major push higher, potentially re-challenging and surpassing the all-time high (ATH) near the $4,380 mark.
For our esteemed clientele and gold investors in Dubai, the current technical structure suggests that the reigning uptrend remains firmly intact, making the focus this week on identifying high-probability entry points within this constructive framework. Gold Trade, Dubai presents this exclusive Weekly Gold Technical Analysis Report to guide your trading and investment decisions.
Key Technical Highlights for the Week Ahead
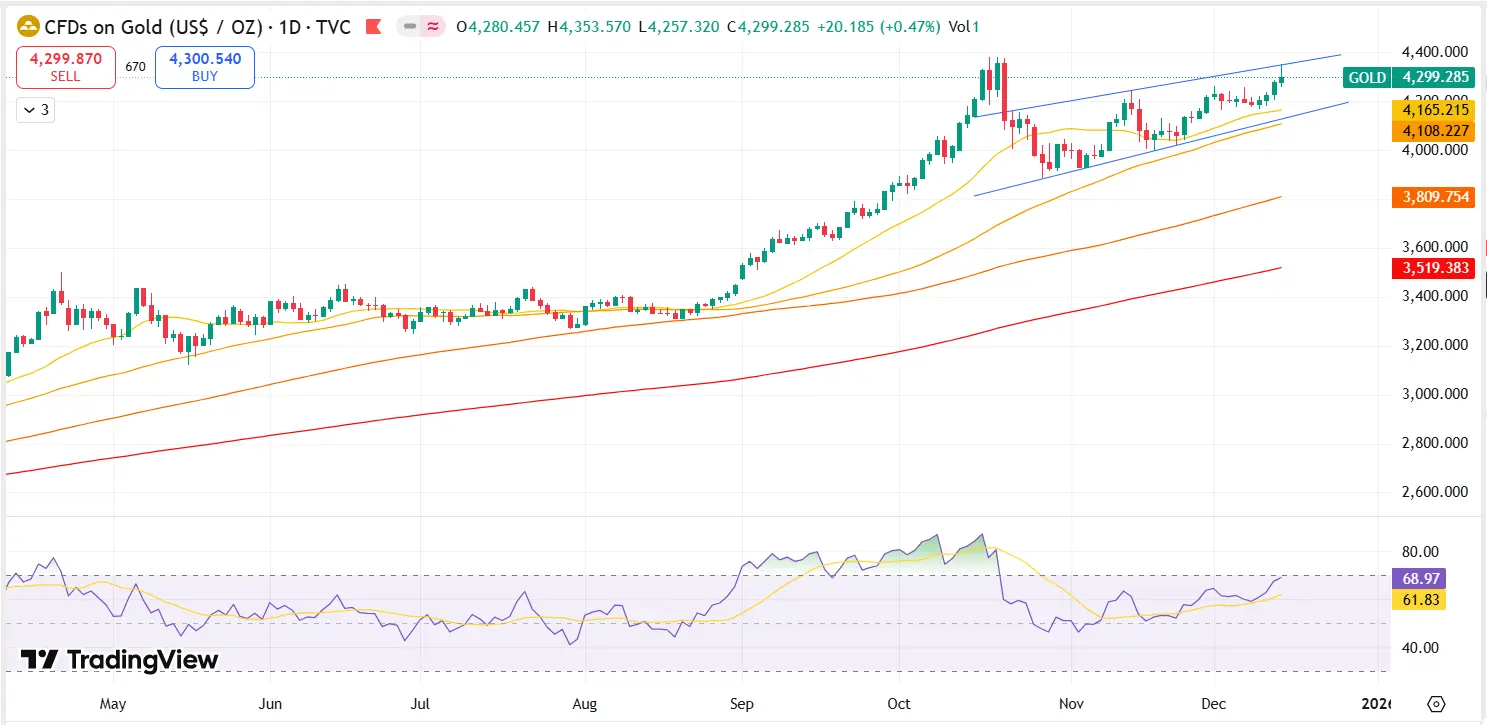
The price of spot gold (XAU/USD) is currently trading comfortably above several critical support levels, confirming the underlying strength of the 2025 rally. The primary technical takeaway is that the short-term pullback seen in late November/early December has successfully relieved overbought conditions without causing any significant structural damage to the overarching bullish trend.
| Indicator | Current Signal | Interpretation |
|---|---|---|
| Trend (Weekly/Daily) | Strong Bullish | Defined by a clear sequence of Higher Highs and Higher Lows. |
| Immediate Resistance | $4,315 - $4,320 | Short-term supply zone; a break confirms next leg up. |
| Primary Target | $4,440 - $4,500 | Breakout target following ATH re-test. |
| Critical Support (S1) | $4,240 | Confluence of 20-day EMA and short-term consolidation range low. |
| Psychological Support | $4,200 | Major psychological and structural anchor. |
| Momentum (RSI 14-Day) | Neutral/Bullish (Near 60) | Plenty of room for further upside momentum without being overextended. |
Detailed Price Action & Chart Analysis
The Continuation Pattern: A Bullish Flag?
On the daily and 4-hour charts, Gold price action has been characterized by tight, low-volatility trading just below the recent swing high. This period of sideways movement, following a strong vertical run-up, often resolves as a Bullish Continuation Pattern, such as a Flag or Triangle.
- Flag Formation: The range between $4,240 and $4,320 can be interpreted as the 'flag' after the 'flagpole' ascent. A confirmed daily closing price above the $4,320 resistance will be the high-conviction signal for the pattern's completion and the commencement of the next bullish wave.
- Volume Profile: While recent volume has been moderate during the consolidation, a surge in trading volume on the breakout above $4,320 would provide a crucial confirmation signal, indicating fresh institutional money flowing into the market.
Moving Averages: The Bullish Anchor
The Exponential Moving Averages (EMAs) remain strongly aligned in a clear bullish sequence.
- The 20-day EMA (currently near $4,240) is acting as dynamic, immediate support. The price remaining above this key average is non-negotiable for maintaining the short-term bullish bias.
- The 50-day EMA (near $4,180) has proved its significance throughout 2025, consistently serving as a structural support line during deeper pullbacks. It is the ultimate line-in-the-sand for the immediate uptrend. A break below this would signal a significant technical correction.
Momentum Oscillators: Ready for the Drive
Both the Relative Strength Index (RSI) and the Moving Average Convergence Divergence (MACD) indicators are positioned to support a strong move higher.
- The RSI is currently hovering near the 60 mark. This level is optimal, suggesting that the gold market has shed its previous overbought status without turning bearish. It leaves ample scope for a breakout rally to reach new highs before hitting exhaustion.
- The MACD line is consolidating above its signal line, and a steepening of the MACD histogram in the positive territory would be a strong indication of renewed bullish momentum taking hold.
Gold Trade's Trading Strategy & Key Levels
Based on this comprehensive technical review, Gold Trade, Dubai maintains a strong bullish conviction for the week of December 15th – 19th, 2025.
Bullish Scenario (Primary)
The most probable path is a bullish breakout.
- Entry Signal: A decisive daily closing price above the $4,320 resistance level. This break would invalidate the recent consolidation and target the next major ceiling.
- Immediate Target (T1): The All-Time High re-test at $4,380.
- Breakout Target (T2): The measured move target is the psychological $4,440 - $4,500 range. This would represent a clear continuation of the Q4 2025 mega-rally.
Bearish Scenario (Alternative)
This scenario would only be triggered by a significant failure of key support.
- Invalidation Point: A sustained daily close below the $4,180 level (50-day EMA support). This would signal that the bulls have lost control and the near-term trend has shifted to corrective.
- Target: A move towards the $4,105 (Fibonacci/Structural Support) and potentially the major psychological $4,000 handle. Note: We assign a low probability to this scenario given the current macro backdrop.
Risk Management & Stop Placement
Disciplined risk management is crucial, especially when trading near all-time highs. For traders initiating a long position on the $4,320 breakout, a stop-loss order placed just below the key structural support at $4,240 is recommended. This manages risk effectively while respecting the bullish structure.
Fundamental Tailwinds Supporting Gold Price
The technical picture is receiving powerful reinforcement from the global economic and geopolitical landscape, which continues to favor the safe-haven appeal of physical gold investment.
- US Dollar Weakness: Expectations for further US Federal Reserve interest rate cuts in 2026 continue to weigh heavily on the US Dollar Index (DXY). A weakening USD reduces the opportunity cost of holding non-yielding gold and makes the commodity cheaper for international buyers, including those trading in the competitive Dubai Gold Market.
- Inflation & Stagflation Fears: Persistent global inflation coupled with slowing economic growth—the specter of stagflation—remains a core, structural driver for buying gold. Gold historically performs exceptionally well in environments of negative real interest rates and high financial uncertainty.
- Central Bank Demand: Geopolitical fragmentation and the trend of de-dollarization are fueling relentless demand from central banks globally, which are adding to their gold reserves at a near-record pace. This institutional demand provides a solid floor for prices and limits downside risk.
Conclusion for Gold Investors in Dubai
The week of December 15th to 19th, 2025, sets the stage for a potentially volatile yet decisively bullish move for gold. Technical indicators point to a strong upward continuation, and the fundamental drivers—a dovish Fed, geopolitical uncertainty, and high inflation—all align to support this view.
Gold Trade, Dubai advises clients to monitor the $4,320 resistance level closely. A decisive break will likely unlock the path to new historical peaks, further validating the enduring role of gold as a cornerstone of wealth preservation and growth.
Disclaimer: This report provides general technical analysis and is not personalized investment advice. Trading in financial markets carries risk, and positions should be taken only after careful consideration and with appropriate risk management.
« Back to News & Reports List