December 15, 2025
Silver Technical Analysis Report - 15 December 2025: The Industrial Giant Poised for a $65 Surge
Executive Summary: XAG/USD Consolidates Near Record Highs, Targeting New Frontiers
As the year-end approaches, silver (XAG/USD) is the standout performer in the precious metals complex, having more than doubled its value in 2025. Trading dynamically around the $63.79 per ounce level, the white metal is consolidating its massive gains near an all-time high, creating a powerful technical launchpad. For our esteemed clientele at Gold Trade, Dubai, this report for 15 December 2025 dissects the chart patterns and indicators that suggest a final, explosive leg higher is imminent, with the next major technical target residing in the $68-$69 range.
The Silver Super-Cycle: Technicals Meet Fundamental Scarcity
The technical strength in silver is not purely speculative; it is underpinned by a profound structural shift in global supply and demand. Silver is experiencing a rare convergence of monetary and industrial demand:
- Monetary Demand: The US Federal Reserve's dovish pivot, driven by softer economic data and sticky inflation, has pushed the US Dollar (DXY) lower and real interest rates into negative territory. This classic environment for hard assets is fueling investment demand.
- Industrial Demand: The "Industrial Super-Cycle" is in full swing, with massive, non-substitutable demand from solar panel production, Electric Vehicles (EVs), and 5G infrastructure. Global supply deficits are widening, as evidenced by significant drawdowns in London and New York vault inventories.
This fundamental tightness provides the ultimate catalyst for the technical breakout.
Key Technical Levels for Silver (XAG/USD) - 15/12/2025
| Indicator | Price Level (USD) | Interpretation |
|---|---|---|
| Immediate Resistance (R1) | $64.66 | The recent all-time high. A confirmed break of this level is the primary buy signal. |
| Primary Target (R2) | $68.00 - $69.00 | The extended technical target derived from the recent Bull Flag's measured move. |
| Key Psychological Resistance | $70.00 | The next major psychological hurdle upon clearing R2. |
| Immediate Support (S1) | $62.00 | The low of the current consolidation box; a key defense point for the bulls. |
| Critical Near-Term Support (S2) | $60.00 | A strong psychological and previous high-breakout level; should attract strong fresh buying. |
| Bullish Invalidating Support | $58.80 | The recent breakout point of the monthly trading range. Must hold to maintain the short-term bullish structure. |
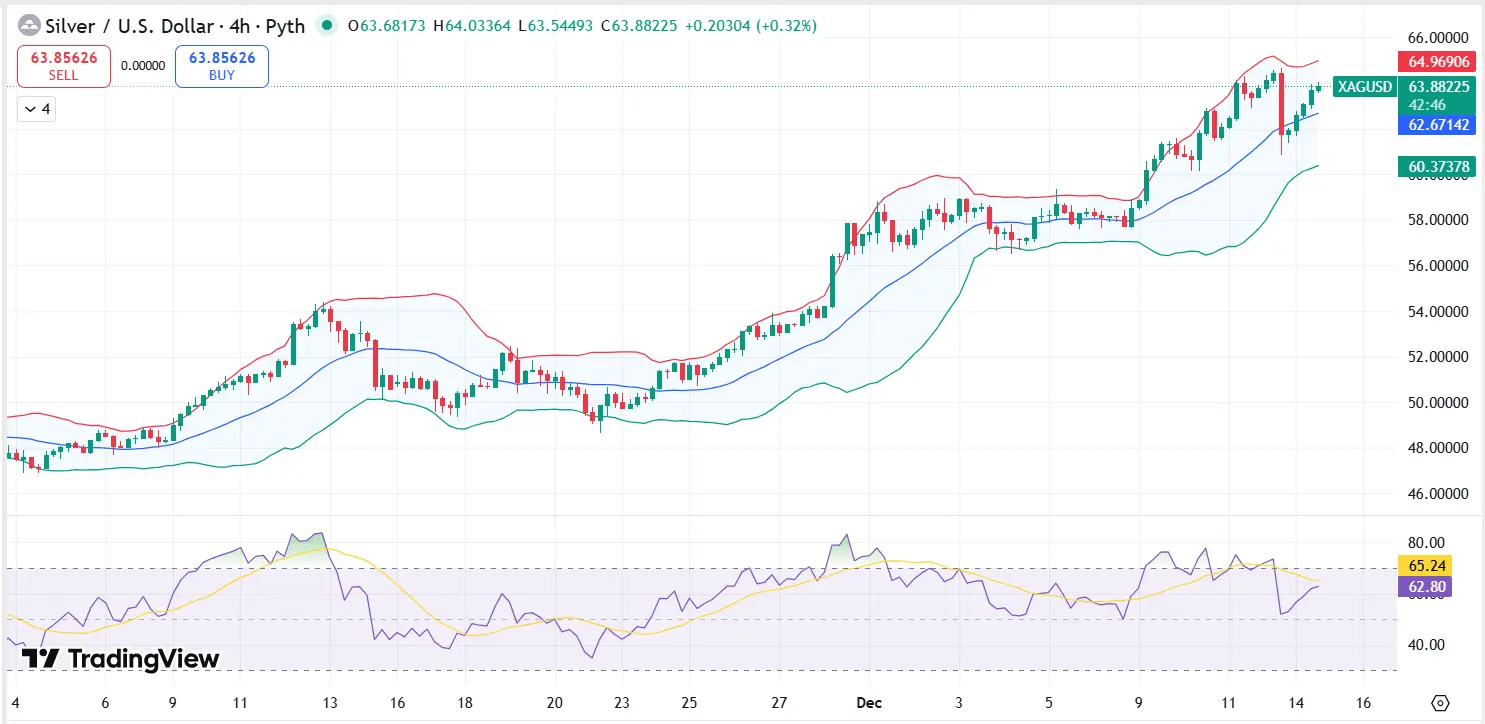
In-Depth Chart Pattern Analysis: The High-Level Bull Flag
On the Daily and Weekly charts, XAG/USD is currently carving out a classic Bull Flag pattern. This is a highly significant continuation pattern, suggesting the strong upward trend from late-October ($45.50 swing low) is pausing before a vigorous resumption.
The pattern consists of a steep, almost vertical ascent (the flagpole, or the initial 50% gain in two months) followed by the current sideways, high-level consolidation (the flag, currently between $61.00 and $64.66). This consolidation, occurring immediately below a new all-time high, is a sign of immense underlying strength, as buyers are not willing to let the price pull back significantly.
The measured move of this pattern projects a technical target for the next leg higher that falls precisely in the $68.00 to $69.00 range. For the Dubai Gold Market, this pattern is the single most important technical cue signaling a continuation of the multi-month uptrend.
The Silver-Gold Ratio: The Amplifier for Silver's Rally
The Silver-Gold Ratio (SG Ratio) , currently observed near 67.61:1 (down from previous highs around 88:1), is now confirming silver’s powerful outperformance.
- A falling SG Ratio means silver is gaining in value faster than gold. This is typical during the explosive, second phase of a precious metals bull market, where industrial and investment demand for silver suddenly "wakes up."
- The historical long-term average for the SG Ratio sits closer to 55:1 or even 40:1, suggesting that even at current prices, silver remains structurally undervalued relative to gold. A move of the ratio towards the 55:1 level, which many analysts expect, would necessitate a significant further outperformance by silver, pushing its price well into the $70+ territory. This ratio remains the strongest fundamental technical argument for a long-term bullish silver price forecast.
Momentum and Volume: No Sign of Exhaustion
Momentum indicators confirm the strength of the move while also flagging the overbought conditions that necessitated the current consolidation.
- RSI (Relative Strength Index): The weekly RSI is in an extremely overbought zone, a reading not seen in over two decades. However, this extreme reading is typical of a genuine, explosive, momentum-driven rally. Crucially, the RSI is now consolidating sideways rather than plunging, which suggests momentum is holding up rather than reversing.
- Volume: The breakout in the prior weeks was accompanied by unusually high trading volume and strong ETF inflows. The current consolidation is occurring on reduced volume, a classic characteristic of a Bull Flag pattern, confirming that selling pressure is light and the market is simply pausing to digest gains.
Outlook for Gold Trade, Dubai Clients: Capitalizing on the Next Leg Up
For sophisticated investors in the Dubai Gold Trade, the current environment demands tactical positioning to capitalize on the anticipated breakout.
- Breakout Confirmation Strategy: Wait for a decisive daily or, ideally, a weekly close above the all-time high at $64.66. This will serve as the confirmation signal for the Bull Flag’s resolution and validate the move toward the $68-$69 target.
- Dip Buying Strategy: Aggressive traders should view any shallow dip toward the $62.00 or $60.00 psychological support levels as a high-conviction buying opportunity. The market shows strong evidence that buyers are eager to accumulate silver on any minor weakness.
- Risk Management: Given the historically high price level, the most critical stop-loss level for maintaining the current structure is the recent breakout point around $58.80. A breach below this would suggest a deeper, more prolonged correction.
The combination of diminishing physical supply, unyielding industrial demand, and the technical signals for a major continuation pattern positions silver as one of the most compelling assets for the close of 2025 and the beginning of 2026. Gold Trade sees high probability that the white metal will soon transition from consolidation to full-blown breakout.
Disclaimer: This Silver Technical Analysis Report - 15 Dec 2025 is provided by Gold Trade, Dubai for informational and educational purposes only. It is not financial advice. Trading in precious metals involves significant risk, and you should not invest any money that you cannot afford to lose. Always consult with a qualified financial advisor before making any investment decisions.
« Back to News & Reports List