December 15, 2025
Gold Technical Analysis Report - 15 December 2025: The Path to $4,400 and Beyond for Gold Trade, Dubai
Executive Summary: Bullish Momentum Dominates as XAU/USD Eyes New Highs
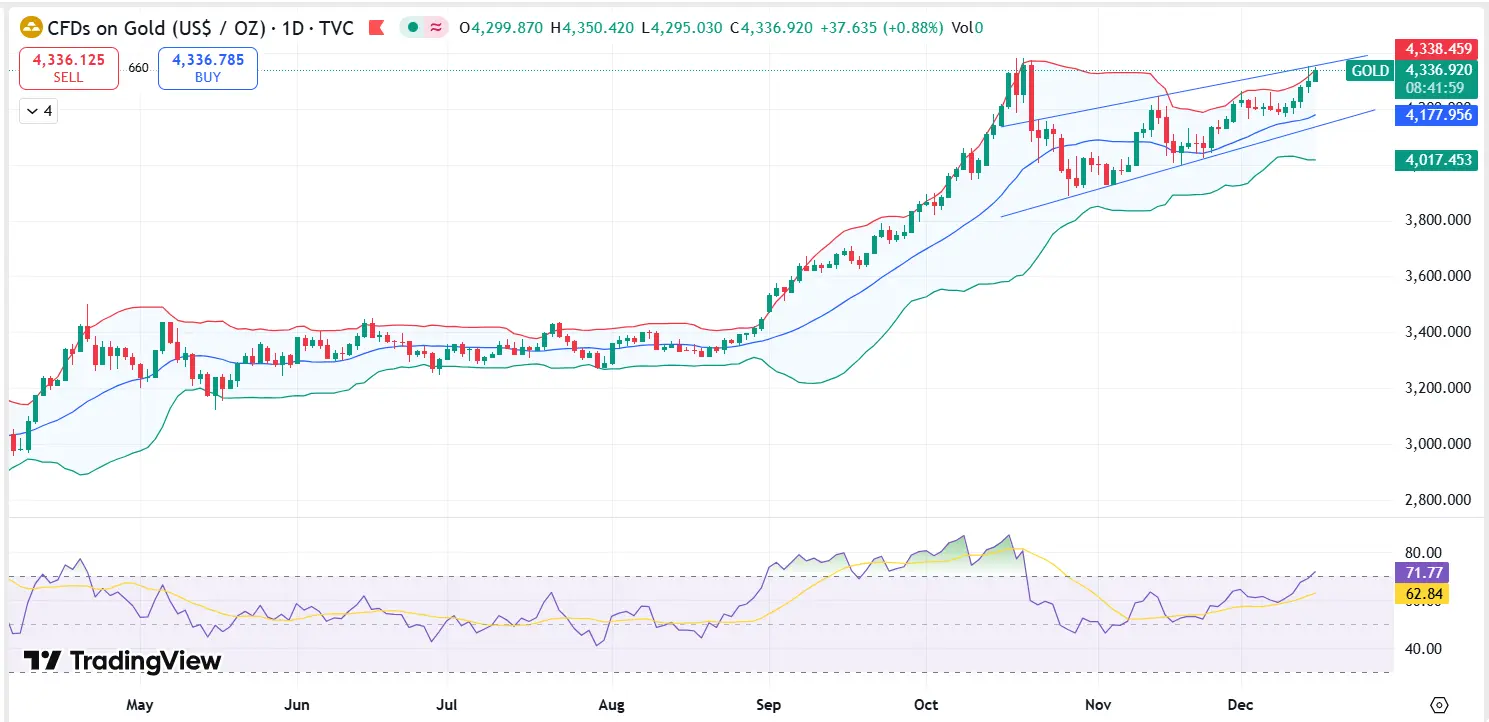
As the global financial year draws to a close, the gold price (XAU/USD) continues to be the dominant story in the precious metals market. Trading decisively above the crucial $4,300 psychological mark, the yellow metal exhibits a strong bullish bias, fueled by persistent global economic uncertainty and the effect of the US Federal Reserve's recent dovish pivot.
For our esteemed clients at Gold Trade, Dubai, this comprehensive technical report for 15 December 2025 dissects the key chart patterns and indicators that are guiding the price action. The technical picture suggests the current consolidation phase is merely a springboard for the next significant leg higher, potentially targeting new all-time highs above $4,400 before the close of 2025.
The Macro-Technical Confluence: Fueling the Gold Rally
The current technical strength of gold is intrinsically linked to two powerful fundamental forces: the weakening US Dollar (DXY) and the expectations for further interest rate cuts in 2026. The dollar's depreciation, following the Fed's December rate cut and hints of a more accommodative policy path, directly enhances the appeal of non-yielding assets like bullion. This macro backdrop provides a solid foundation for the technical indicators to confirm a sustained uptrend.
Key Technical Levels for Gold (XAU/USD) - 15/12/2025
| Indicator | Price Level (USD) | Interpretation |
|---|---|---|
| Immediate Resistance (R1) | $4,356 | The high-day close from Friday and a key breakout level. A decisive close above this is critical. |
| Primary Target (R2) | $4,430 | Next significant technical and psychological target, representing a major extension level. |
| Key Psychological Resistance | $4,500 | A major long-term target once R2 is cleared. |
| Immediate Support (S1) | $4,300 | Now acts as the initial, strong psychological support following the recent breakout. |
| Critical Near-Term Support (S2) | $4,175 | The 38.2% Fibonacci Retracement of the late-October advance. Must hold to maintain immediate bullish structure. |
| Bullish Invalidating Support | $4,112 | A weekly close below this level would signal a deeper correction. |
In-Depth Chart Pattern Analysis: The Bullish Flag Formation
On the Daily chart, XAU/USD has recently completed a crucial technical maneuver: the break and sustained close above the multi-week consolidation range. This action, following the aggressive rally from late October, is interpreted as a classic Bullish Flag or Pennant formation.
This pattern is highly significant for gold price prediction as it suggests the preceding strong uptrend (the flagpole) is likely to resume with equal or greater force once the flag (the consolidation) is broken. The decisive breach of the $4,300 mark over the past week confirms the activation of this pattern, suggesting a measured move target that extends well into the $4,500-$4,600 range. Traders in the Dubai Gold Market should closely monitor the volume accompanying this breakout, as high volume will validate the strength and sustainability of the move.
Moving Averages: A Confirmation of Strength
The trend-following indicators universally confirm the dominant uptrend.
- The price is trading well above the 50-Day and 100-Day Exponential Moving Averages (EMAs) , with the 50-Day EMA acting as dynamic support, currently positioned near the $4,220 mark.
- The alignment of the shorter-term EMAs (10-period and 20-period) crossing above the longer-term EMAs (50-period and 100-period) in recent weeks is a powerful "golden cross" signal on the daily timeframe, reinforcing the conviction of long-term investors.
Momentum Oscillators: Overbought, Yet Resilient
The Relative Strength Index (RSI) on the daily chart remains firmly in overbought territory (above 70) , a condition that has been sustained for several weeks.
- While typically a precursor to a pullback, the fact that the RSI has held in this elevated range without a sharp correction is a hallmark of a powerful, runaway trend. This indicates that the buying pressure is not just aggressive but persistent, suggesting that traders are willing to buy the dips quickly and not engage in significant profit-taking.
- The MACD (Moving Average Convergence Divergence) indicator remains highly supportive, with the MACD line positioned far above the signal line. The broadening gap between the two lines confirms that bullish momentum is accelerating, not fading.
Outlook for Gold Trade, Dubai Clients: Strategy for the Week Ahead
For our clients and investors in the Dubai Gold Market, the immediate strategy should remain focused on maintaining a "buy on dips" approach, as long as the critical support levels hold. The risk-reward profile favors a continued advance, provided the $4,300 level is successfully defended.
- Breakout Confirmation: A clear, daily closing candle above the immediate resistance at $4,356 is the next major trigger. This would open the immediate pathway to testing the primary target at $4,430.
- Managing Pullbacks: Short-term traders should use the $4,300 psychological level as a reference point. Any retracement toward the $4,175 to $4,220 zone (confluence of the 38.2% Fib and the 50-day EMA) should be viewed as a high-probability opportunity for new entries, not a reversal.
- Risk Management: Despite the overwhelmingly bullish gold forecast, the market is at record high levels, making sharp, intra-day corrections a possibility. Maintaining a vigilant stop-loss, particularly below the key weekly low or the $4,112 invalidation mark, is essential for capital preservation.
The fundamental narrative of global diversification, central bank buying, and lower real rates remains robust, perfectly aligning with the technical signals for a year-end surge. Gold Trade advises that the next few weeks are critical for capitalizing on this established uptrend as the market primes itself for a fresh record high.
Disclaimer: This Gold Technical Analysis Report - 15 Dec 2025 is provided by Gold Trade, Dubai for informational and educational purposes only. It is not financial advice. Trading in precious metals involves significant risk, and you should not invest any money that you cannot afford to lose. Always consult with a qualified financial advisor before making any investment decisions.
« Back to News & Reports List